Add financial reports and charts to your business plan
In the realm of business planning, articulating your financial health and projections is paramount.
You can embed your financial reports and charts into your business plans. This feature ensures a thorough representation of your financial standing, providing a solid foundation for your business's projected success.
Advantages of Adding Financial Reports to Your Business Plan:
- Clarity and Credibility: Financial reports provide a clear picture of your business's fiscal status and projections, lending credibility to your plan when engaging with investors or lenders.
- Informed Decision-Making: They allow stakeholders to make informed decisions based on concrete financial data, understanding the viability and potential return on investment.
- Strategic Planning: Detailed financial analysis helps in identifying areas of strength and those needing improvement, guiding strategic adjustments and growth strategies.
- Benchmarking Progress: Including financial forecasts sets benchmarks for future performance, enabling you to measure actual progress against projections.
Steps to Add Financial Reports and Charts:
There are 3 effective strategies for adding financial data to your Business Plan:
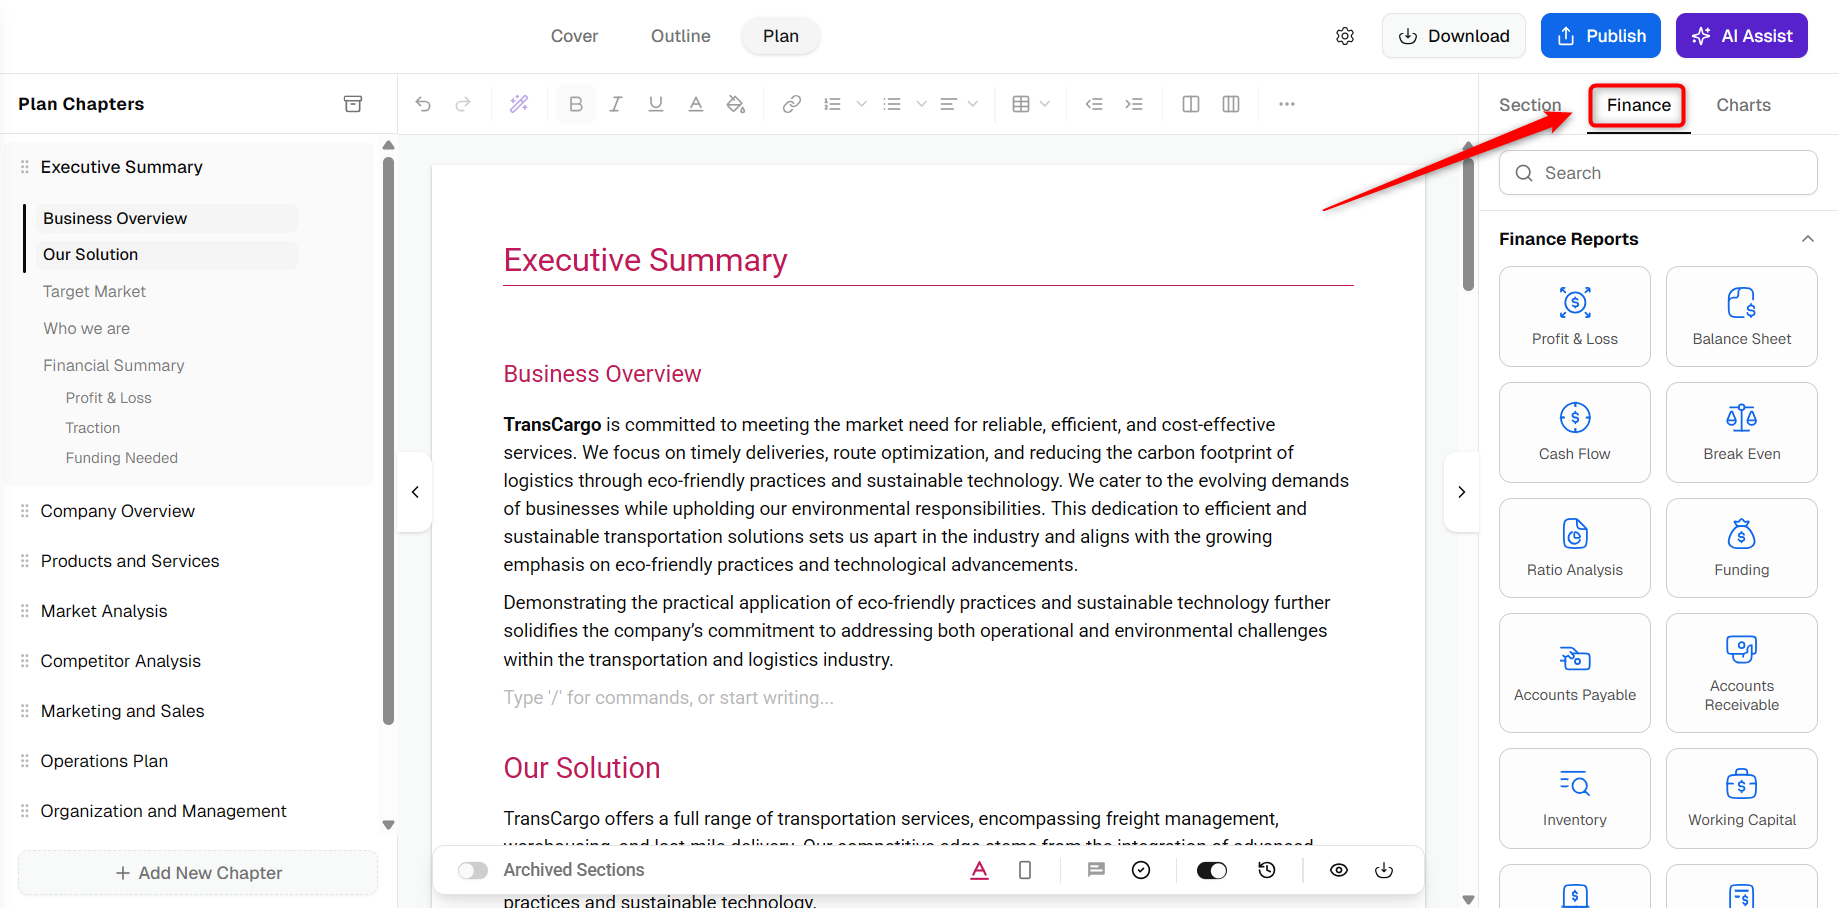
Adding from the Finance Section:
NOTE: This setup is crucial as the financial section pulls data directly from the Finance Forecasting module. Ensure you input data into the Finance Forecasting module to avoid empty reports in your business plan.
- 1
-
Open your business plan and select the Finance section.
- 2
-
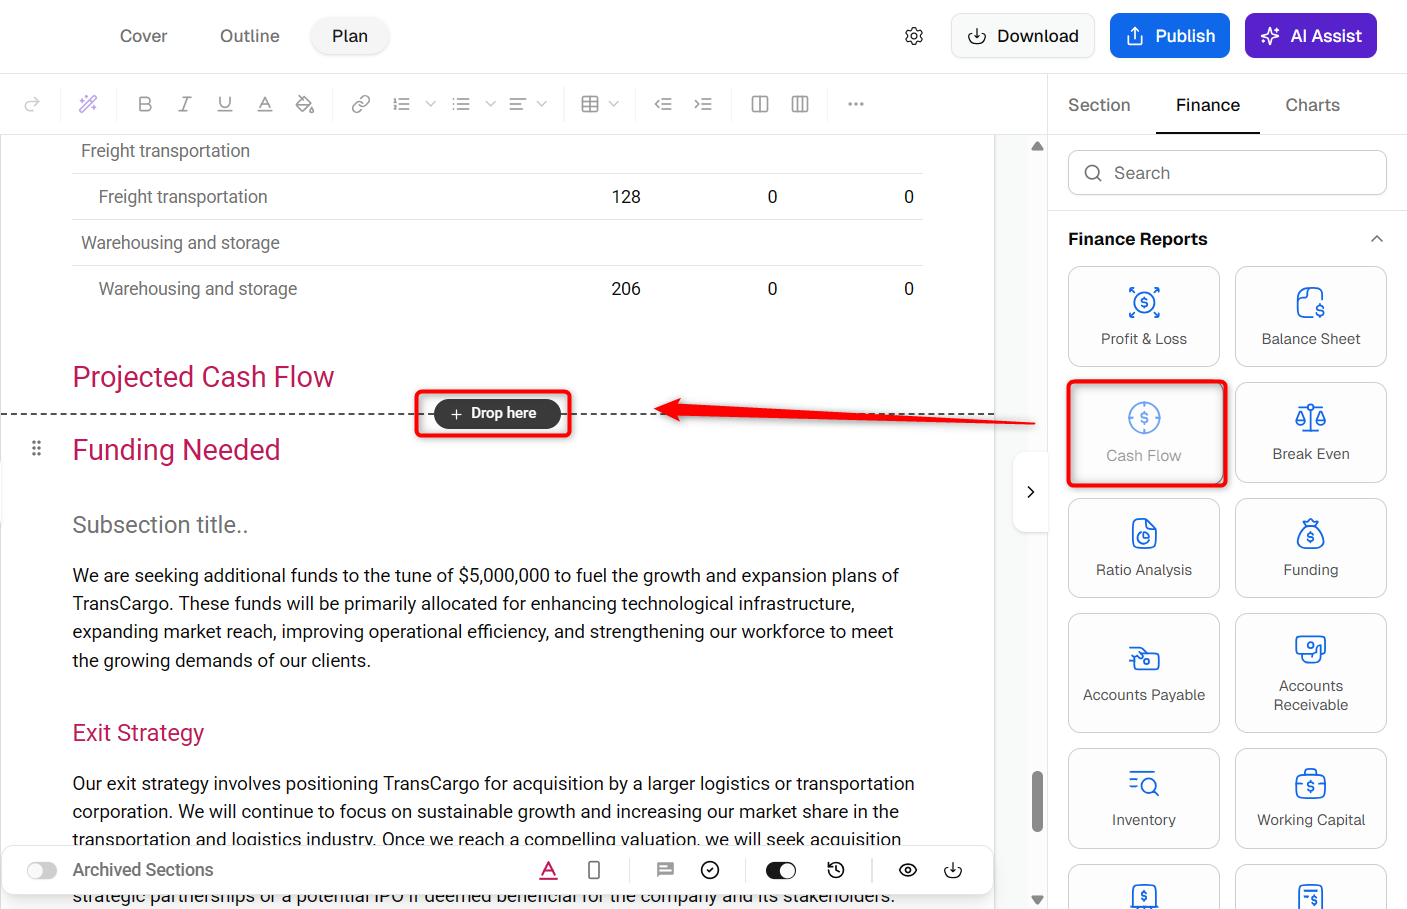
Use the intuitive drag-and-drop feature to include key financial statements like profit and loss, cash flow, and balance sheet into your plan.
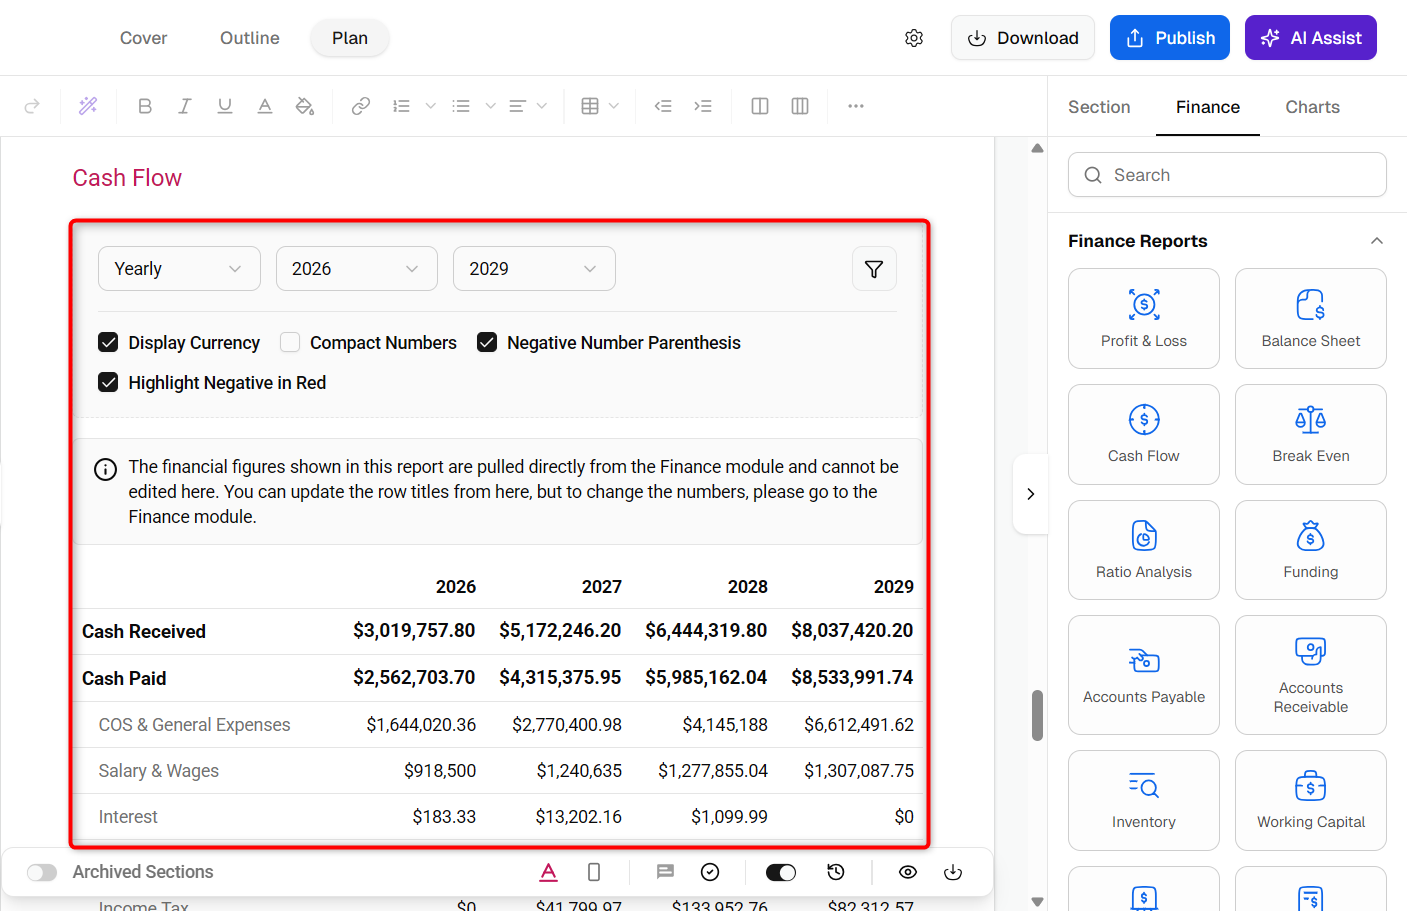
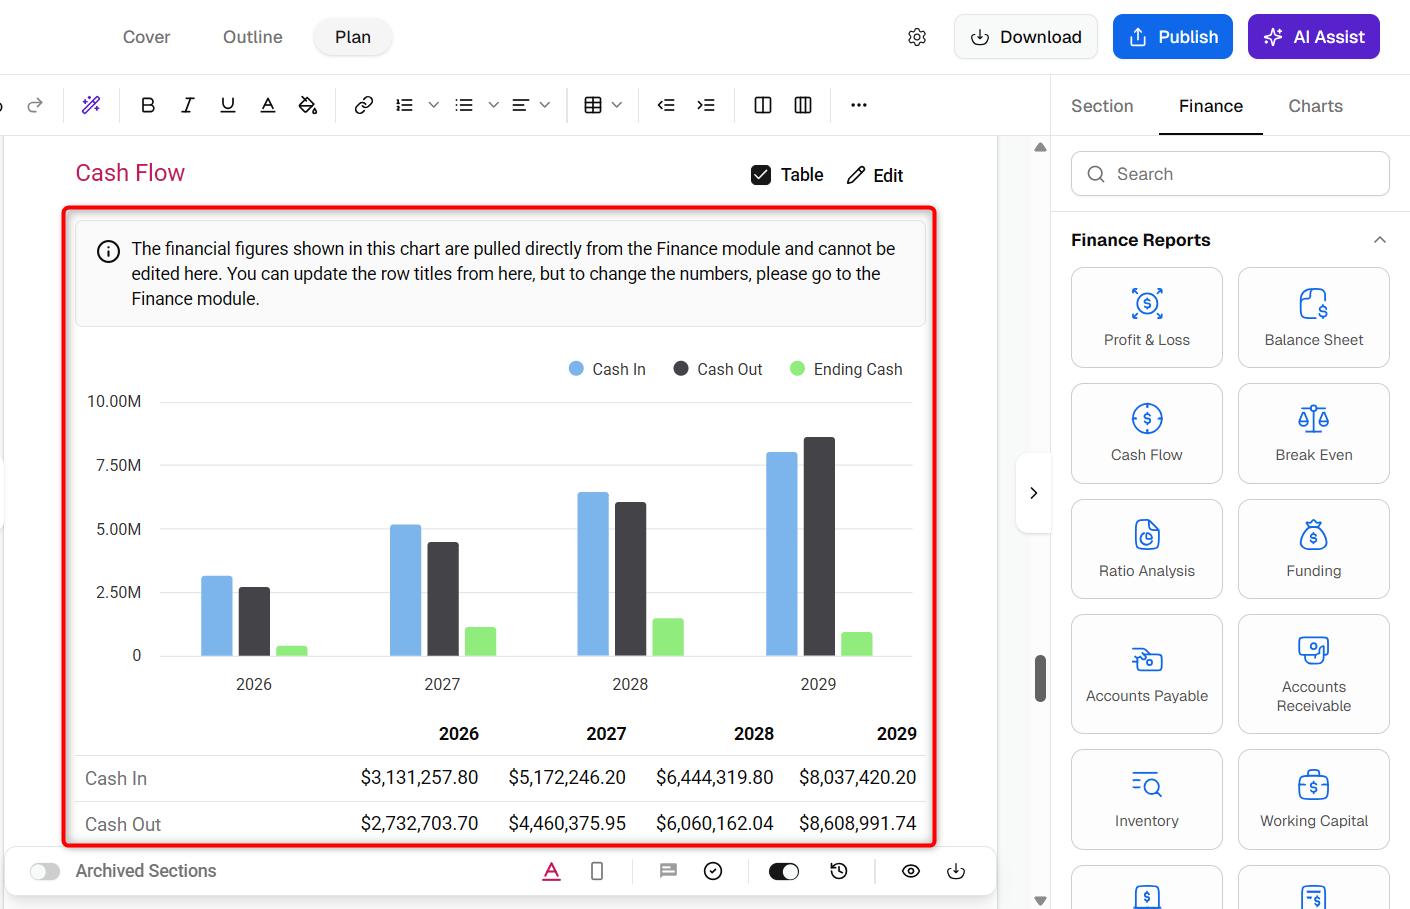
This is how the reports in your Business Plan appear once data has been entered into the Finance Forecasting Module.
- 3
-
Opt for the Finance Chart section to add financial charts, making your data visually appealing and easier to digest.
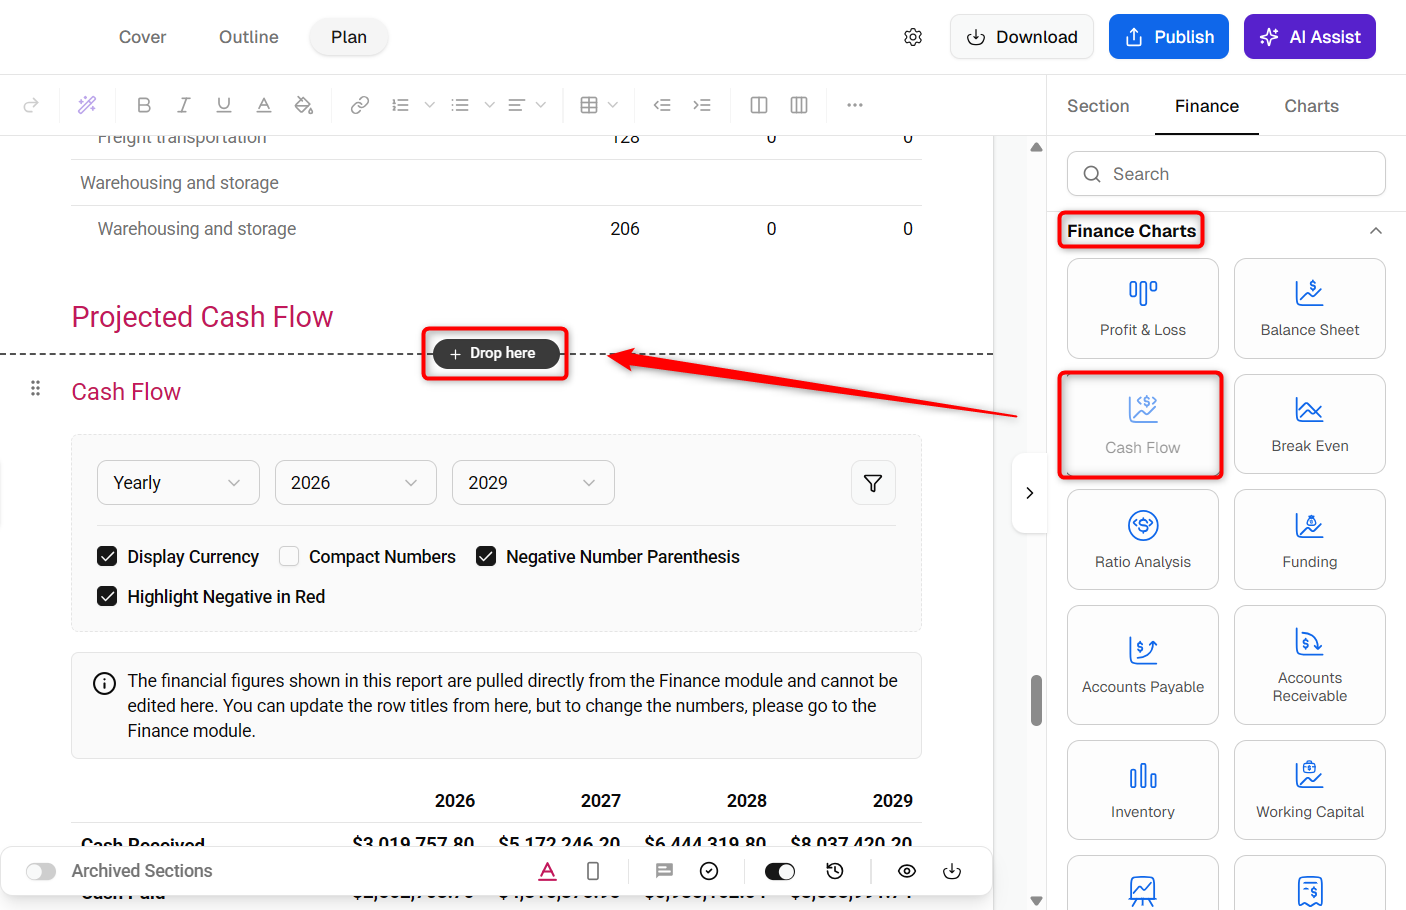
The charts in your Business Plan will adopt this appearance after you've provided data to the Finance Forecasting Module.


TIP: Easily customize financial reports and charts in your business plan. Find out more in this guide.
Use Embed and Import Excel:
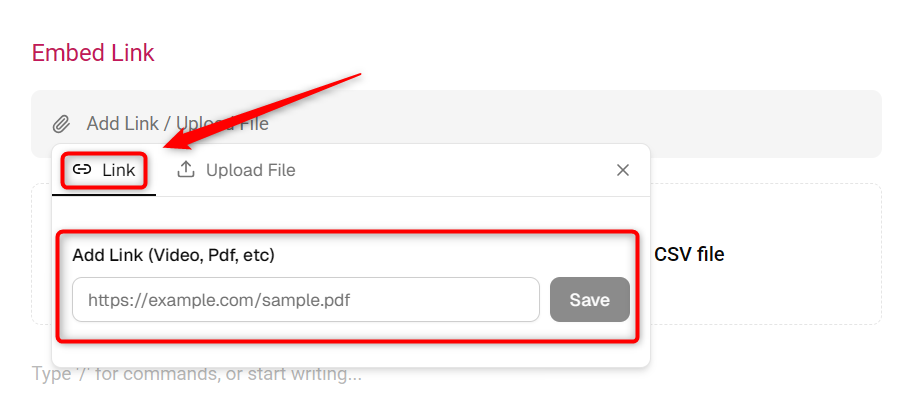
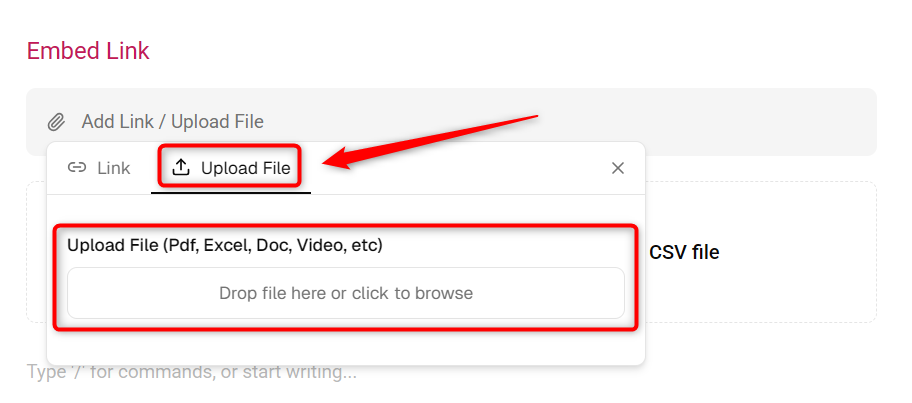
- Embed: The Embed feature allows you to directly integrate your existing Excel data into your business plan. You have the flexibility to either use a link to embed the Excel sheet files or opt for direct upload within your Business Plan
- Import Excel: The Import Excel feature is designed to directly import existing Excel financial data into your business plan.
- 1
-
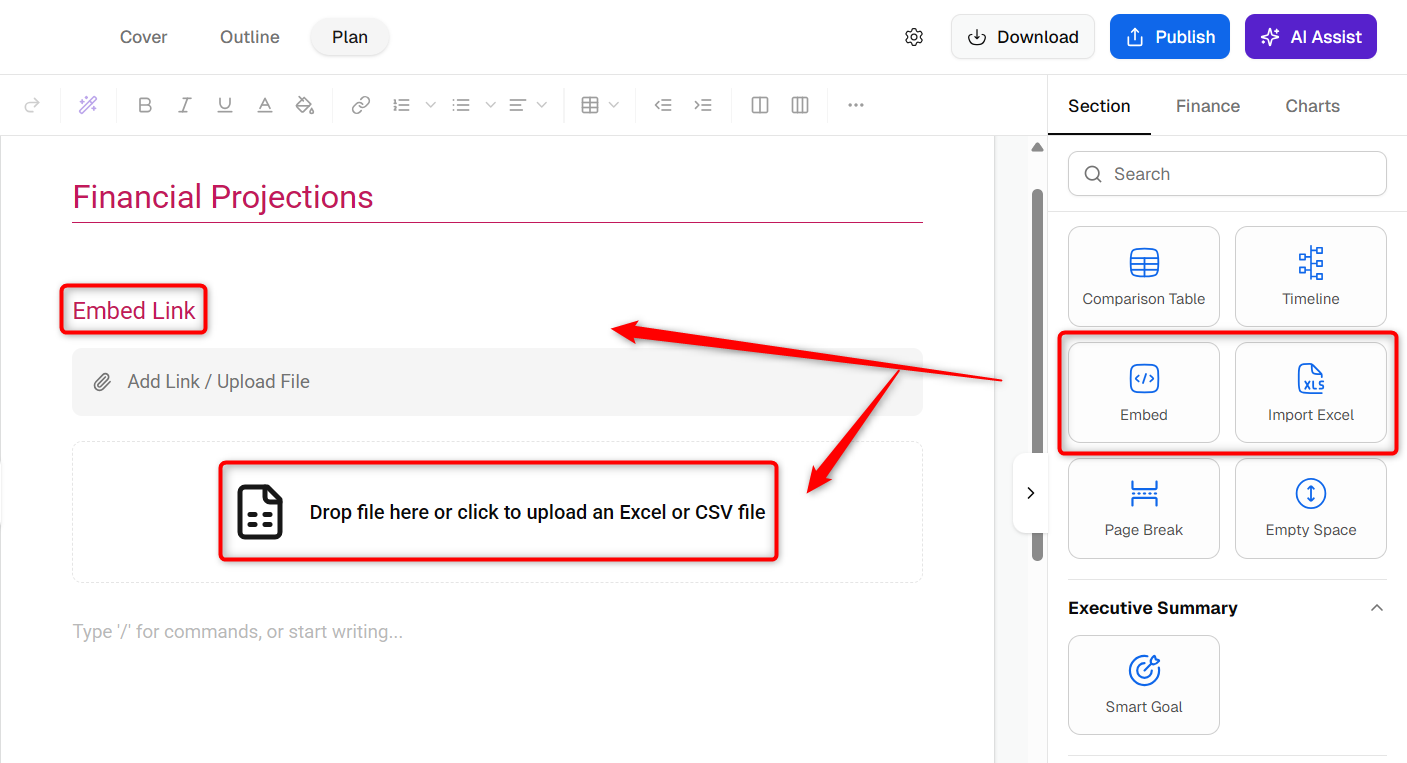
Open your business plan builder. On the Section page, where you'll find the option to Embed and Import Excel.
- 2
-
Follow the prompts to embed your Excel data directly into the Business plan with a drag-and-drop feature.
- 3
-
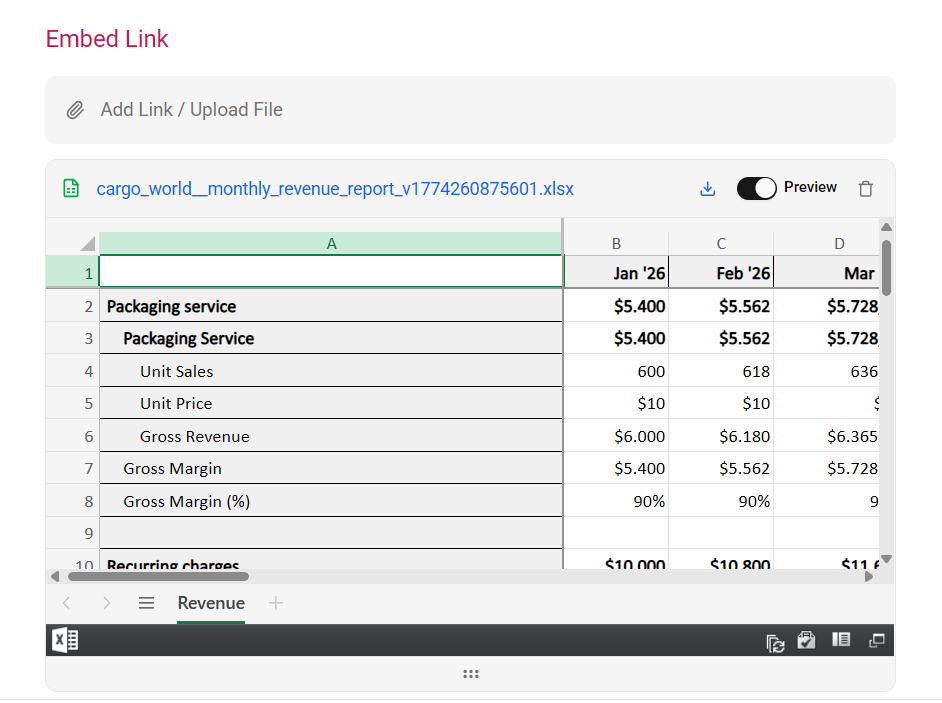
For Embed, add your Link directly or choose the Upload File option accordingly.
Once you've embedded the Excel sheet, it will look like this in your Business Plan. Please see the below image:
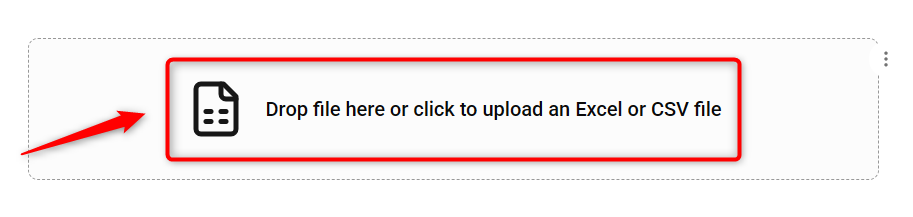
- 4
- For Excel, directly click on the Upload an Excel sheet option.
-
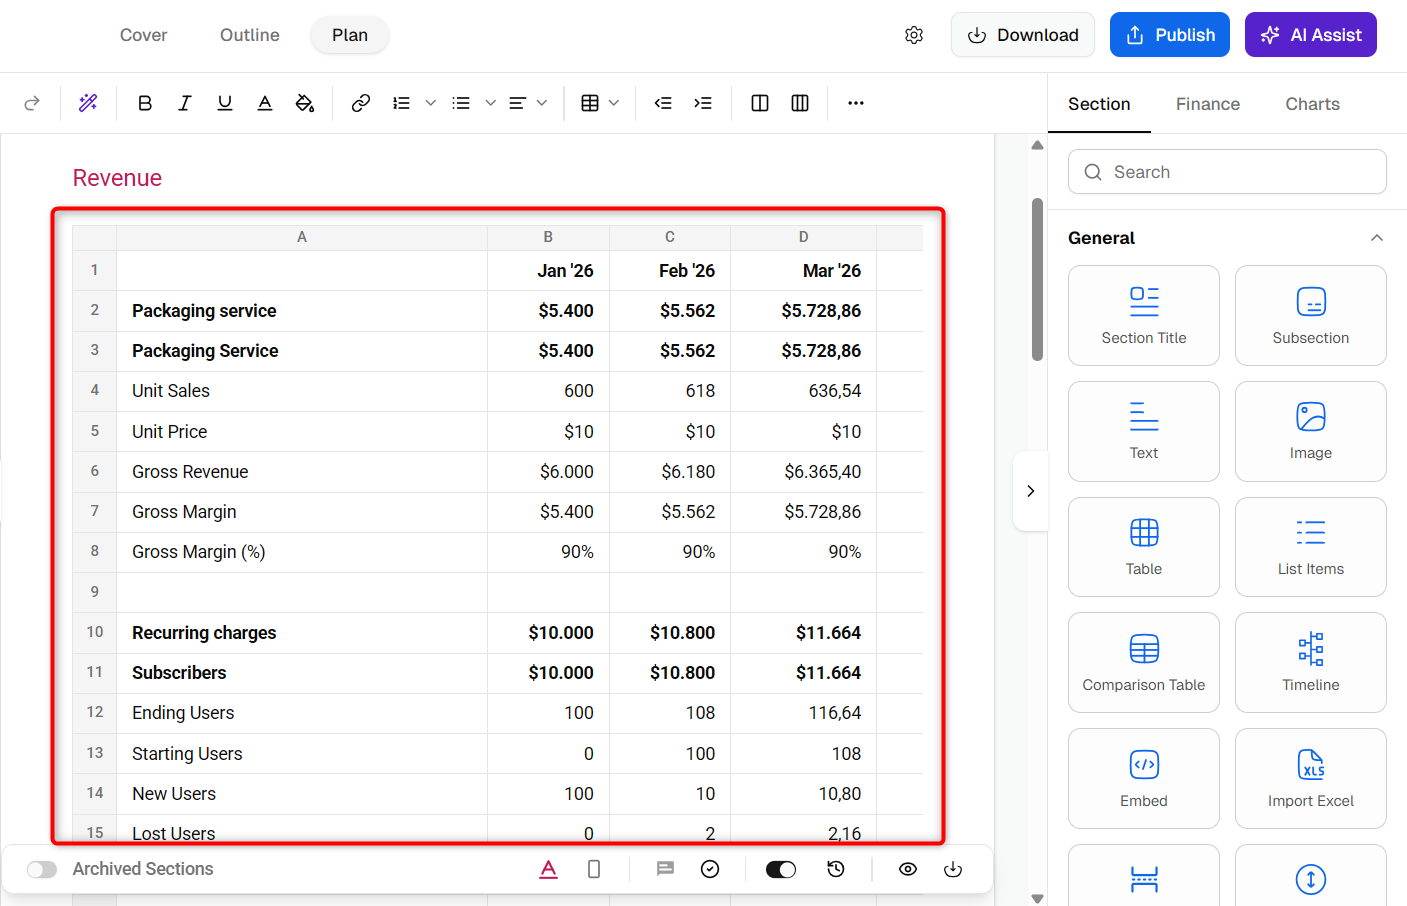
Your document's Excel file will reflect this format after you import it using the Import Excel option.

NOTE: You can use the Import Excel option to showcase your financial data inside the business plan. However, this data remains static and will not be connected to the financial forecasting module, as it's treated as manually added information.


Custom Charts & Table:
A comprehensive business plan is not just about persuasive narratives and strategic outlines; it also requires a clear presentation of financial data.
In the Business Plan builder, the ability to customize your financial presentation is paramount.
Not only can you create custom charts that visually represent your financial projections and outcomes, but you can also integrate tables for a more detailed data breakdown.
- 1
-
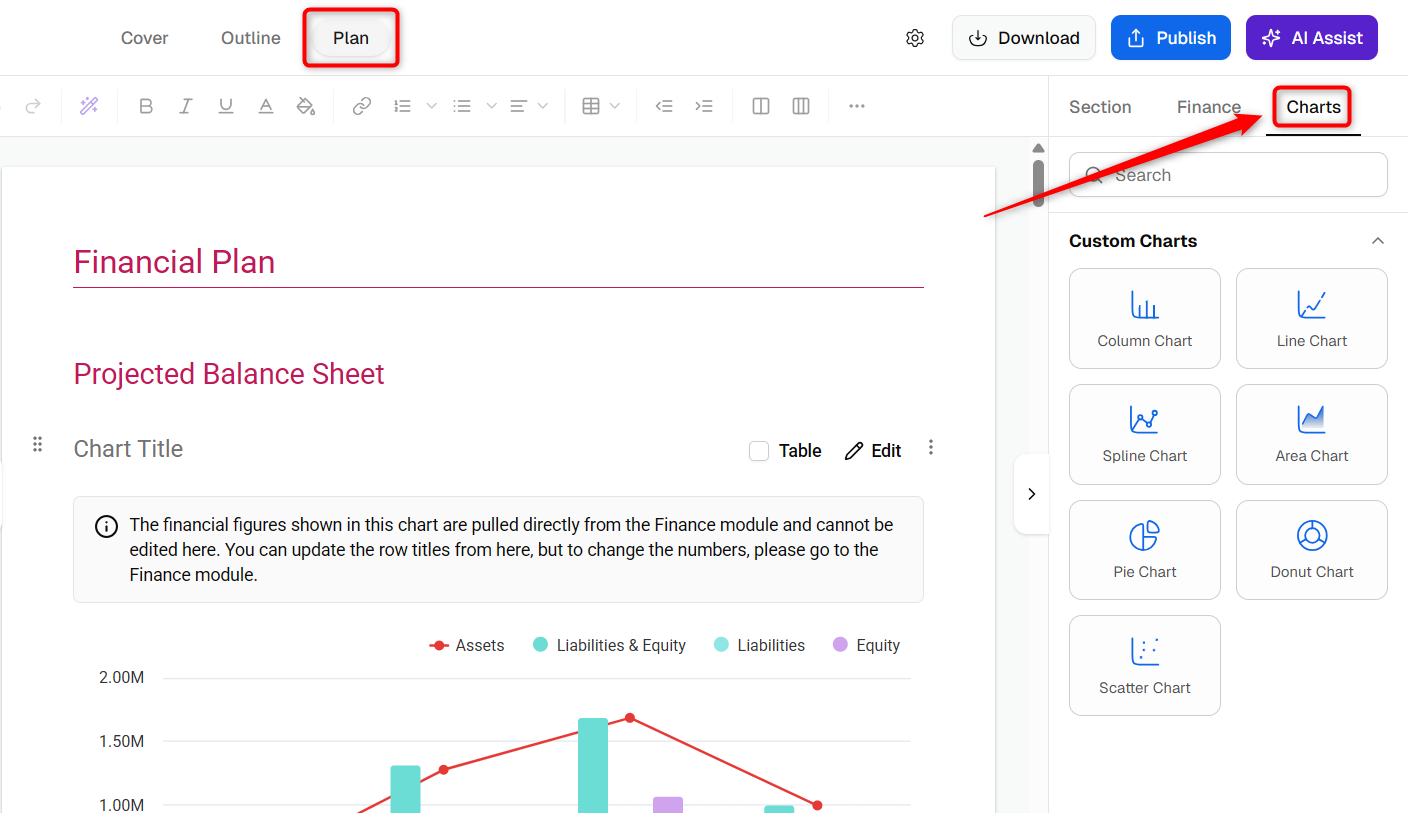
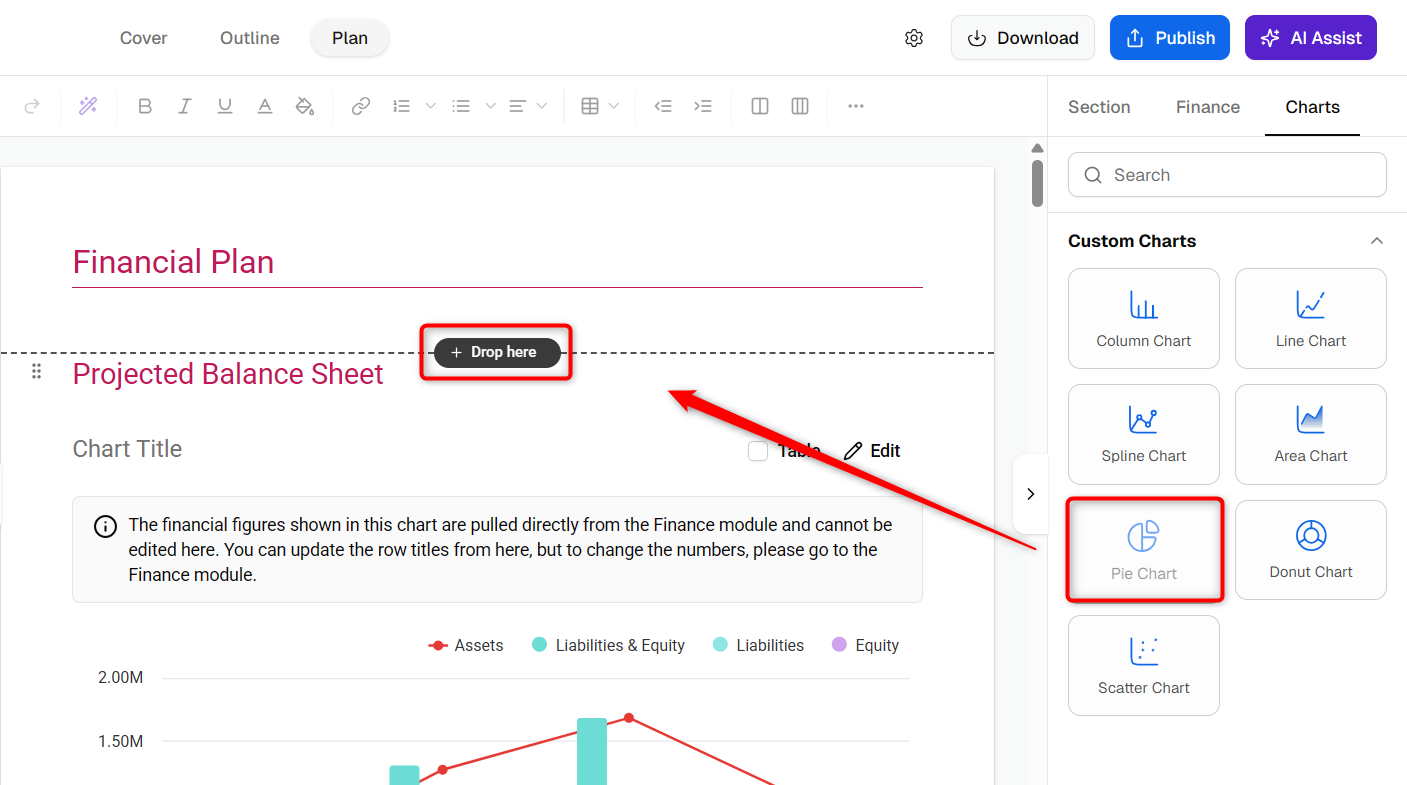
To add the Chart, navigate to your business plan and locate the Charts section on the left sidebar.
- 2
-
Utilize the drag-and-drop feature to add a chart to your Business Plan.
- 3
-
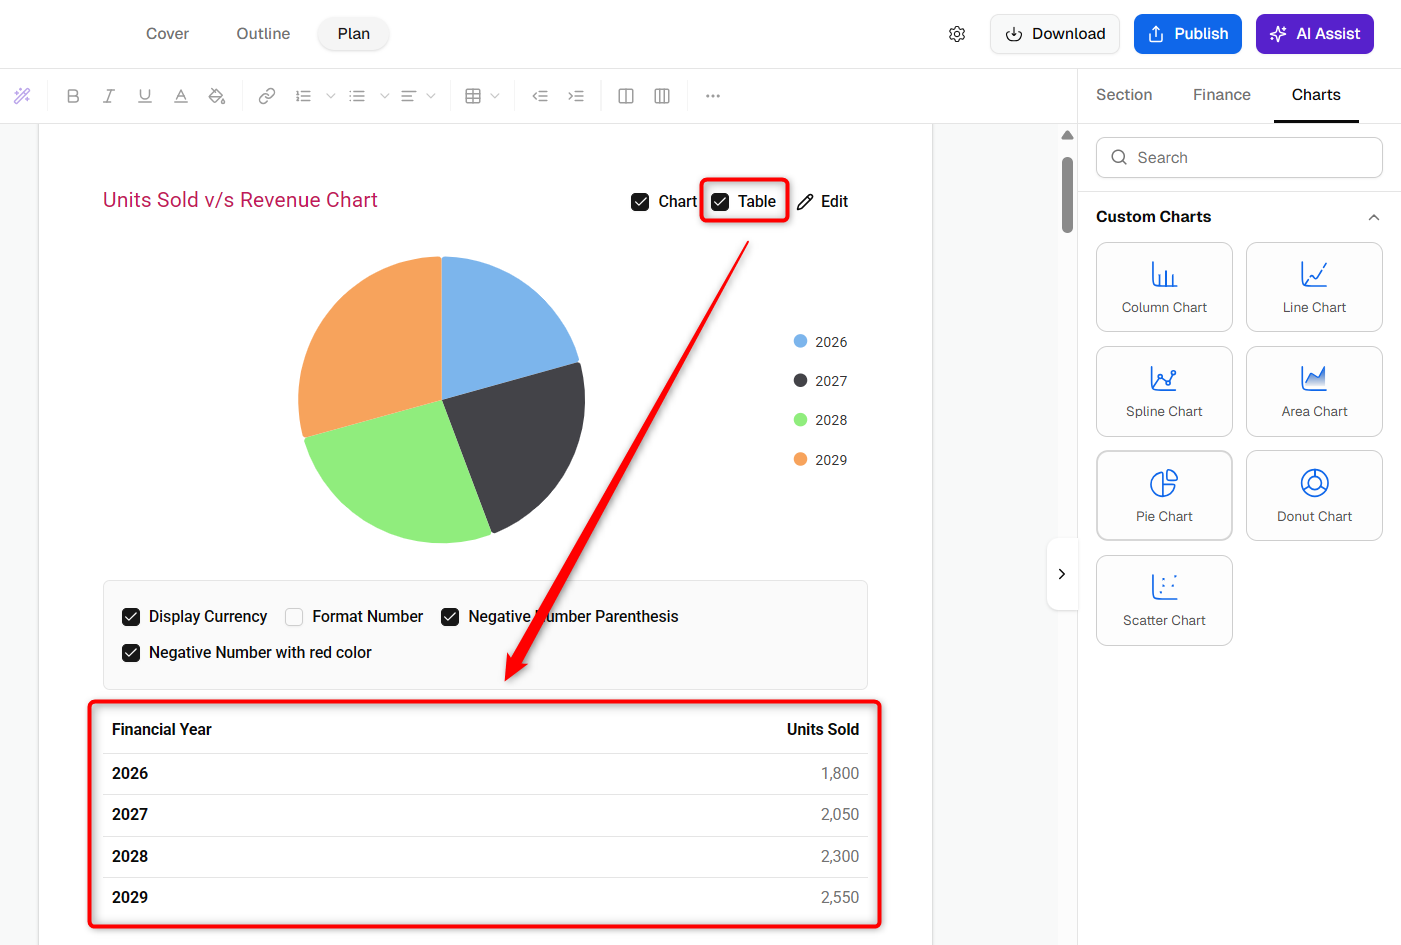
After adding the chart, utilize the Table option available within the Charts section to add a table.
- 4
-
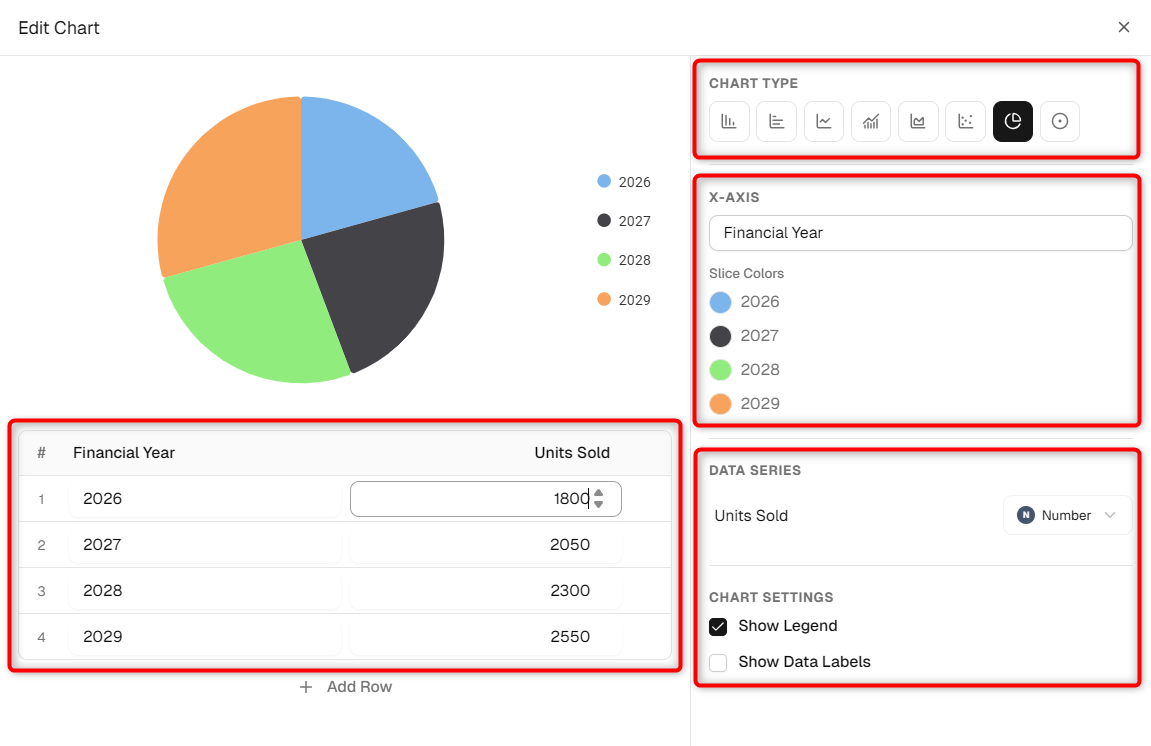
After adding the chart, to customize it and incorporate specific financial streams, click on the Edit button on the chart.
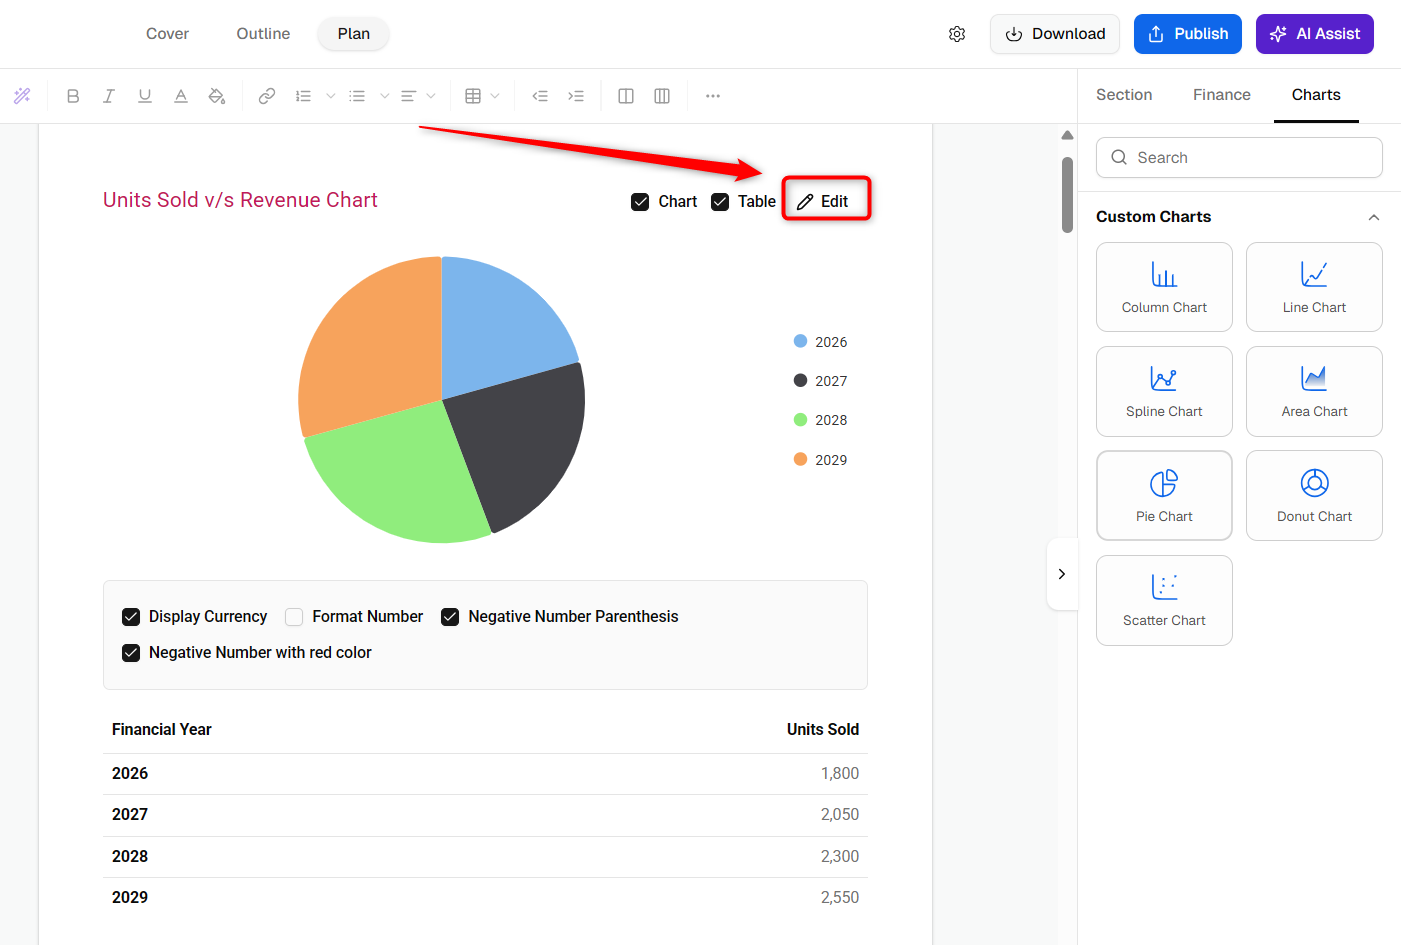
This will allow you to tailor the chart to reflect your financial data accurately, ensuring it aligns with your business strategy and presentation needs.


By following these steps, it not only simplifies the financial planning process but also ensures entrepreneurs can effectively communicate their financial strategy, reinforcing the strength and feasibility of their business concept.