
Customize finance reports in your business plan
You can customize your finance reports in your business plan by adjusting their settings. Change the time period view, choose which rows to include or exclude, and adjust how figures are displayed.
The Finance section of your business plan is linked to the Finance Forecast module — every figure shown is pulled from your forecast. Configure your Finance Forecast module before adding finance reports to your plan; otherwise all figures will appear as zero (0).
Any change you make in the Finance Forecast module updates the finance report in your business plan in real time, so the two stay in sync.
Steps:
- 1
-
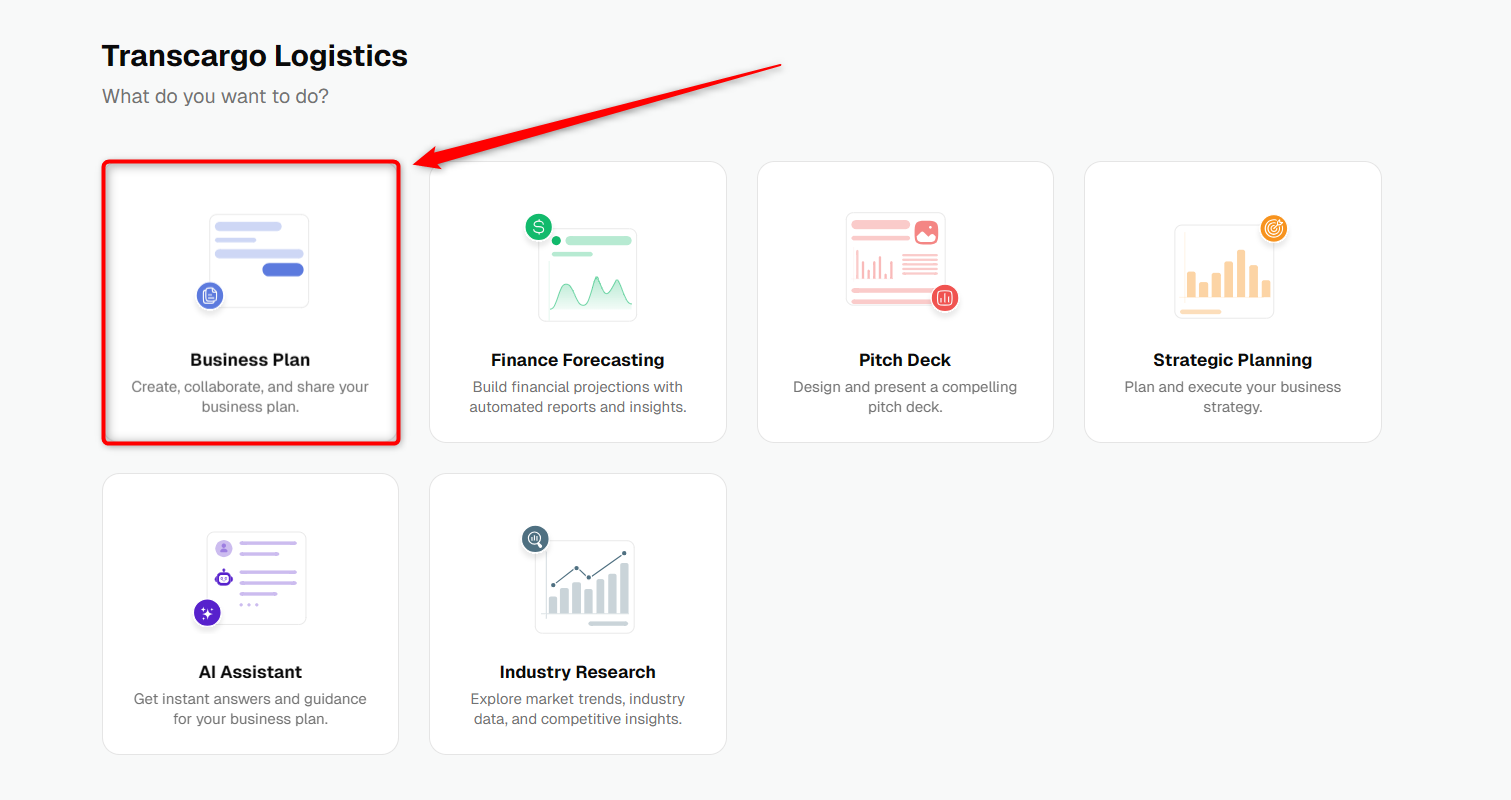
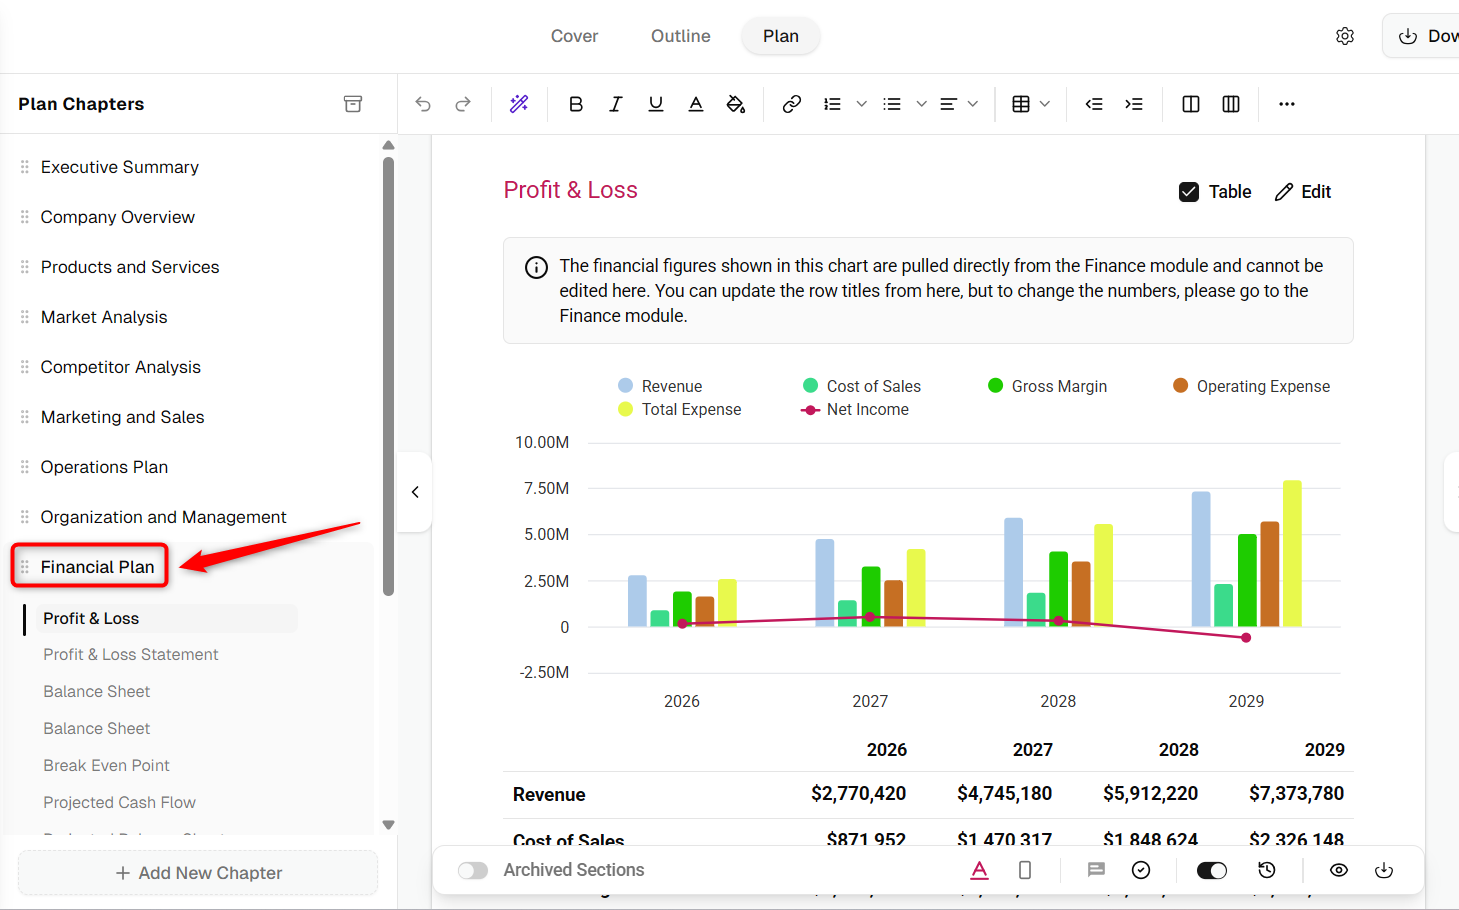
Open the business plan editor, switch to the Plan tab, and select the Financial Plan chapter.
- 2
-
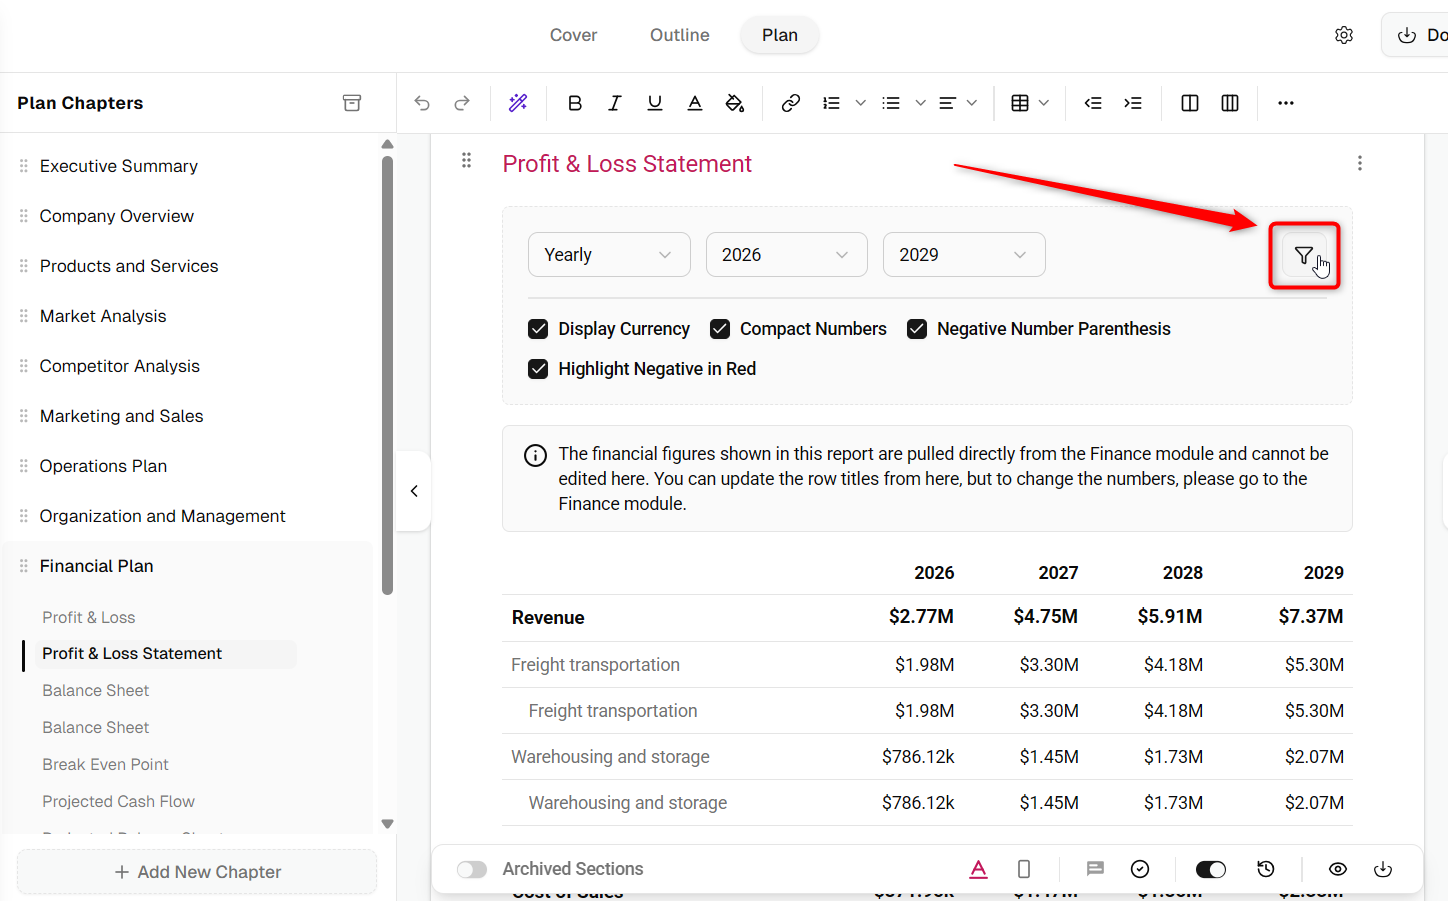
Choose any finance report and click the filter icon in its top-right corner.
The Financial Plan chapter contains the key finance reports — Profit & Loss, Cash Flow, and Balance Sheet.
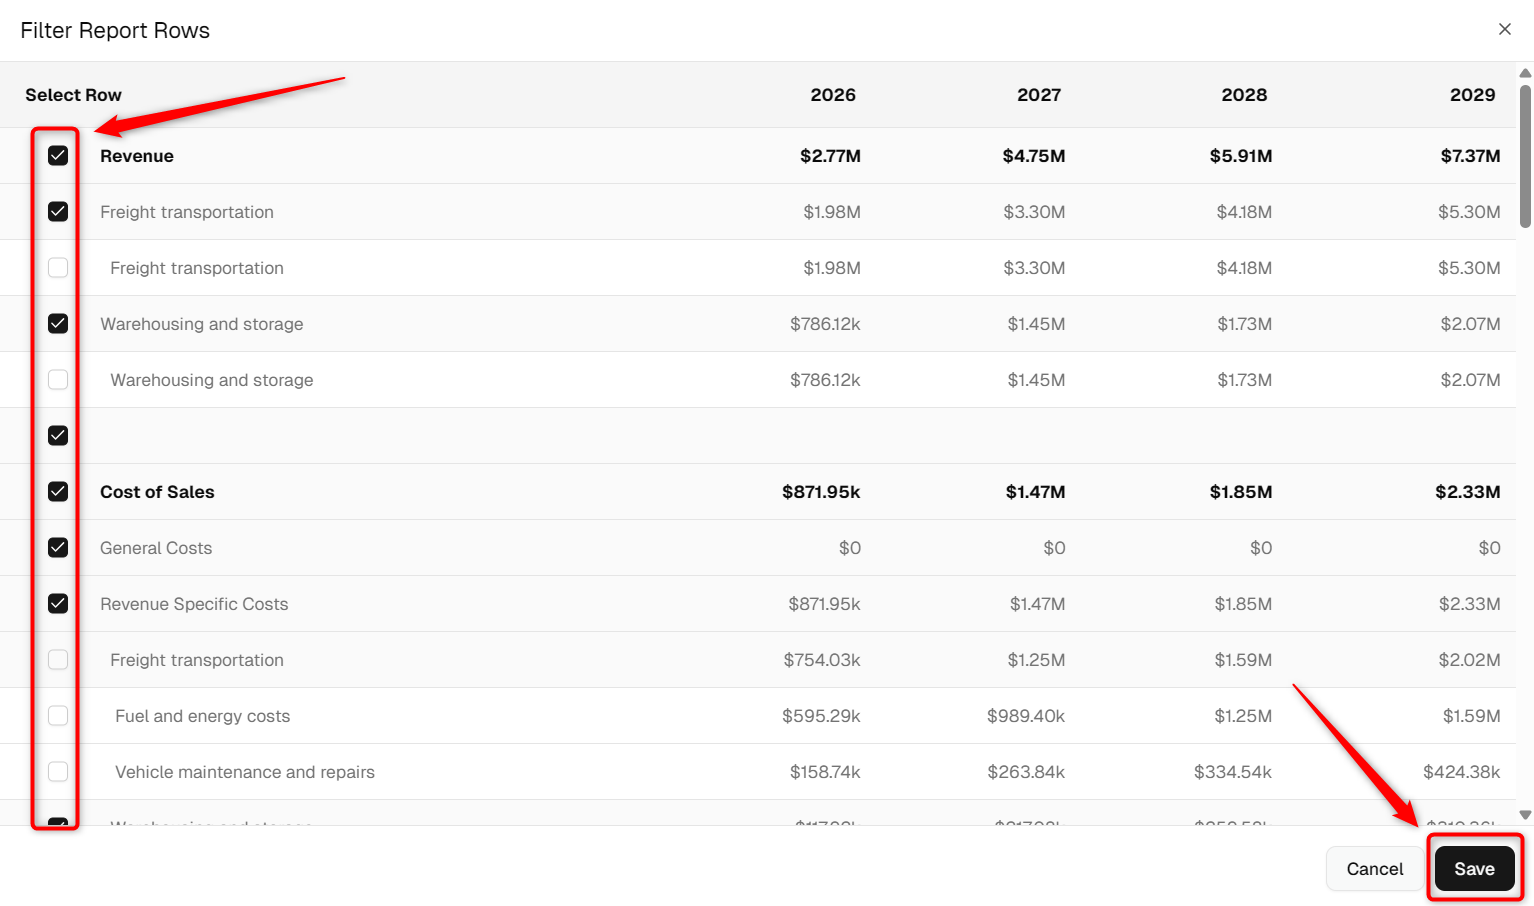
The Filter Report Rows pop-up appears. Use the Select Row checkboxes to include or exclude rows, then click Save.
- 3
-
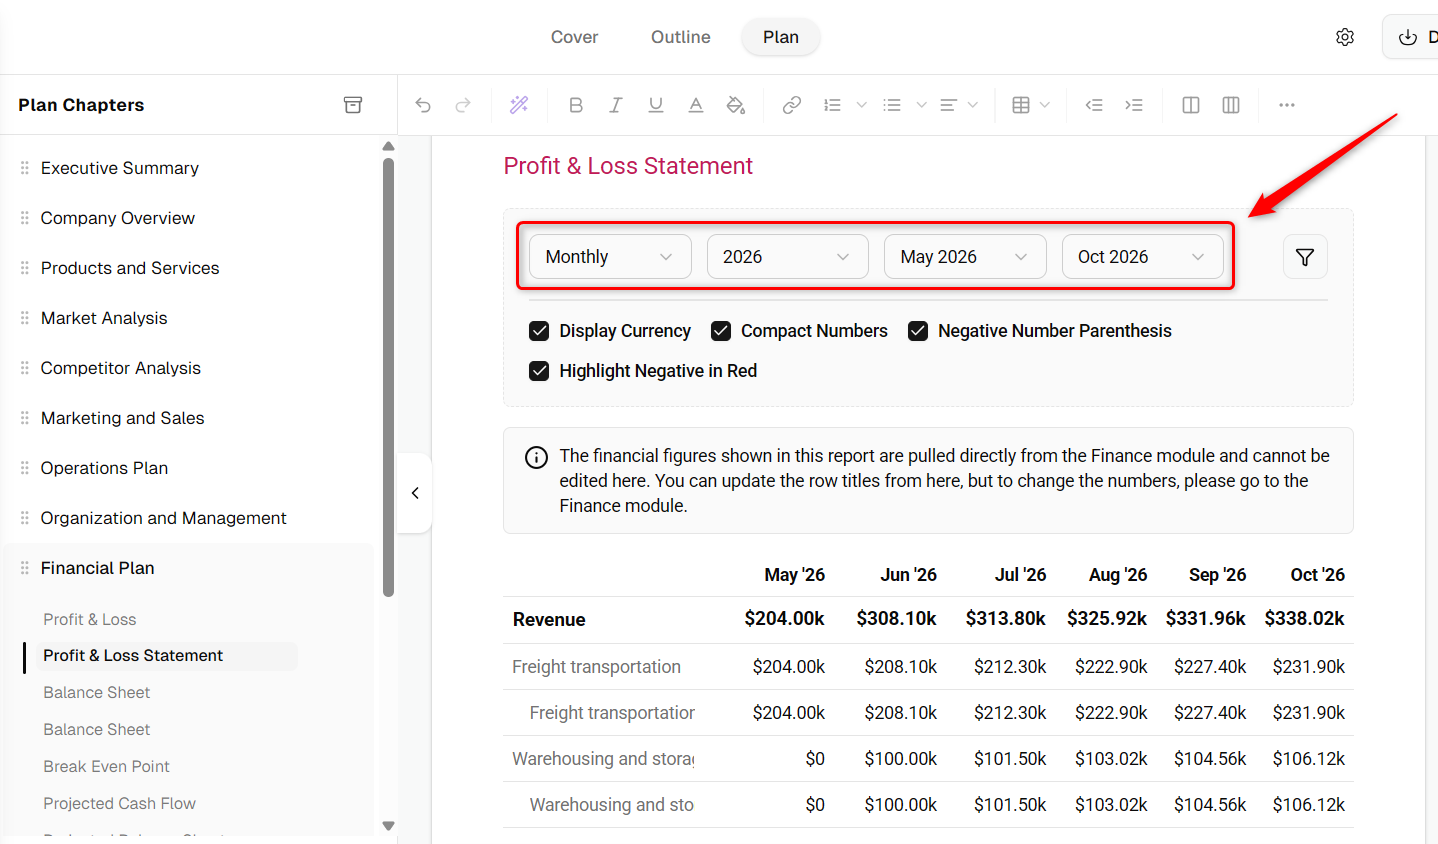
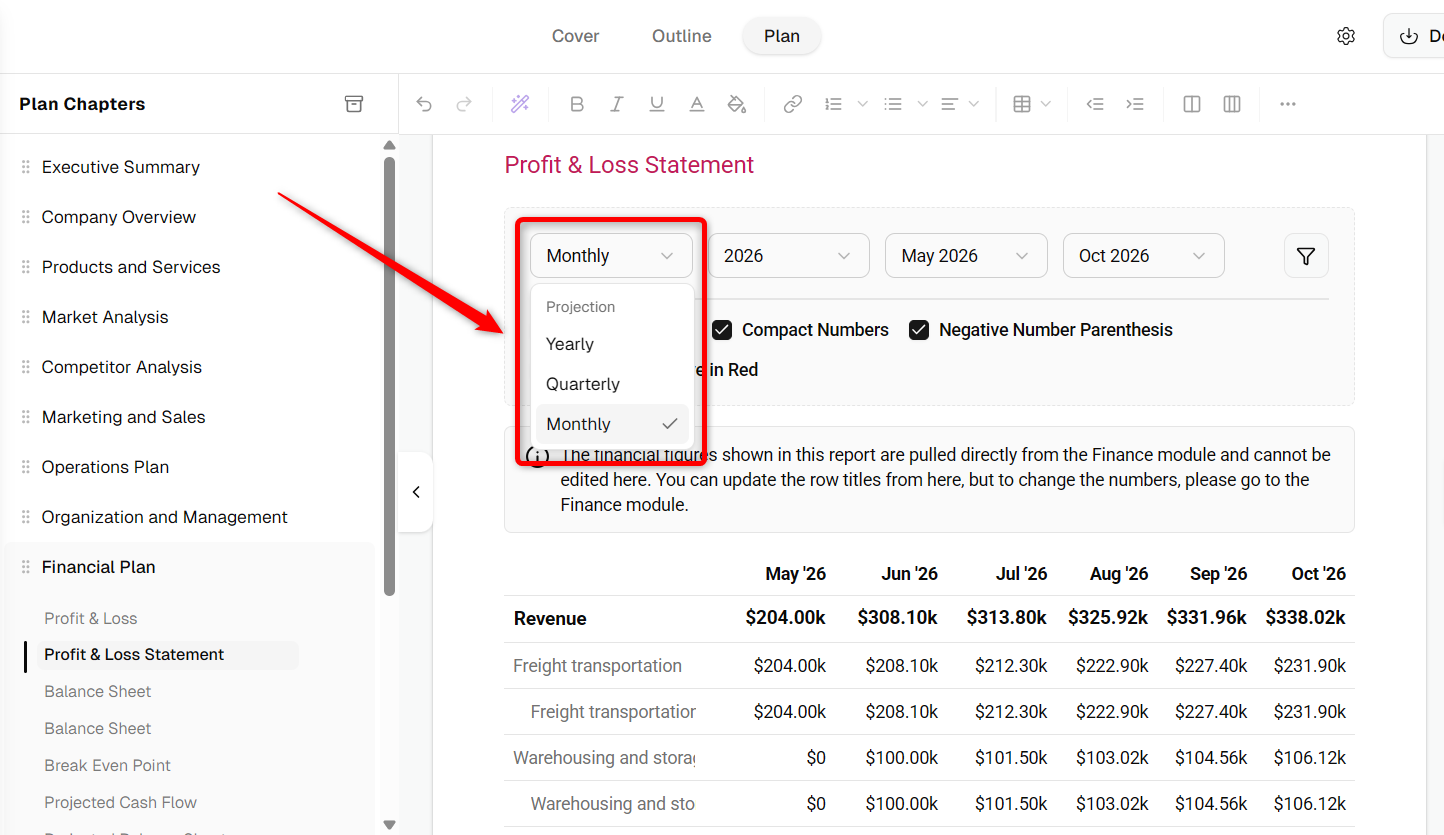
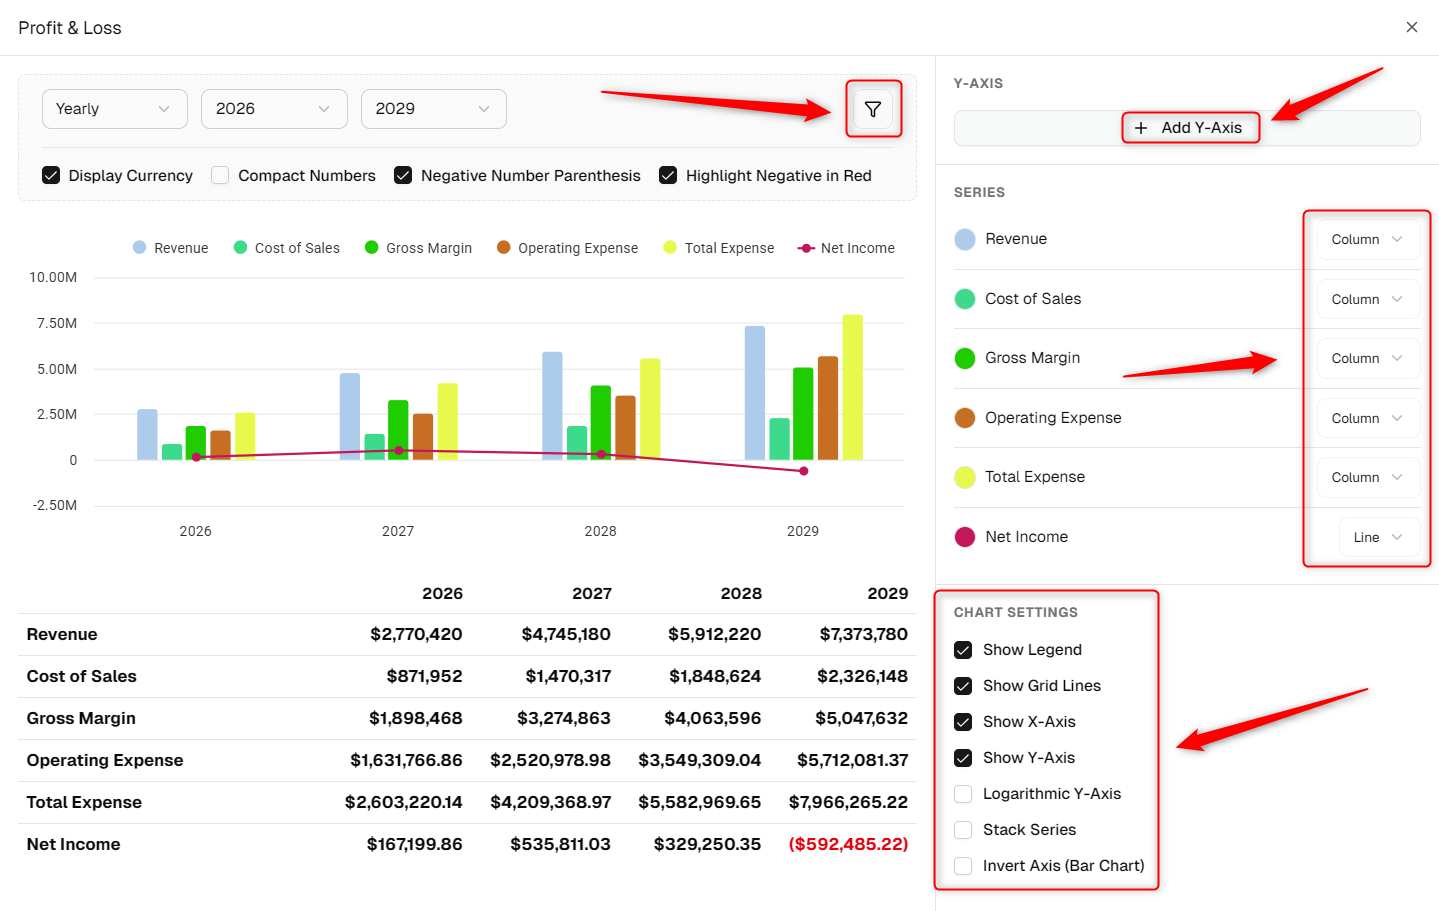
Use the time-period dropdown to switch between Monthly, Quarterly, and Yearly views. The year dropdowns next to it set the year range.
- 4
-
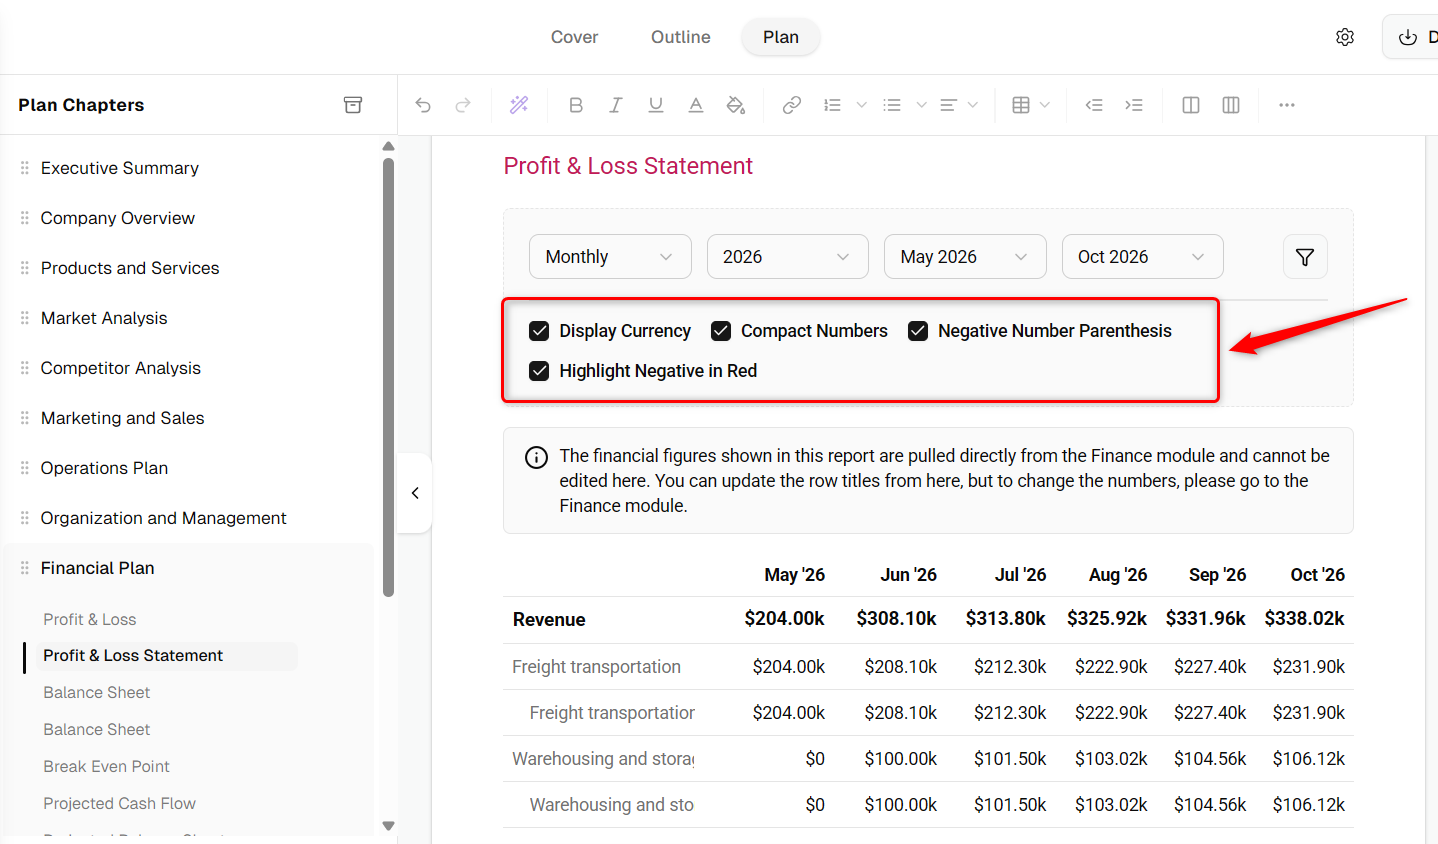
Toggle Display Currency, Compact Numbers, Negative Number Parenthesis, and Highlight Negative in Red using the checkboxes below the dropdowns.
You can also customize and edit the finance section charts. Click the Edit option on any chart to open its settings.
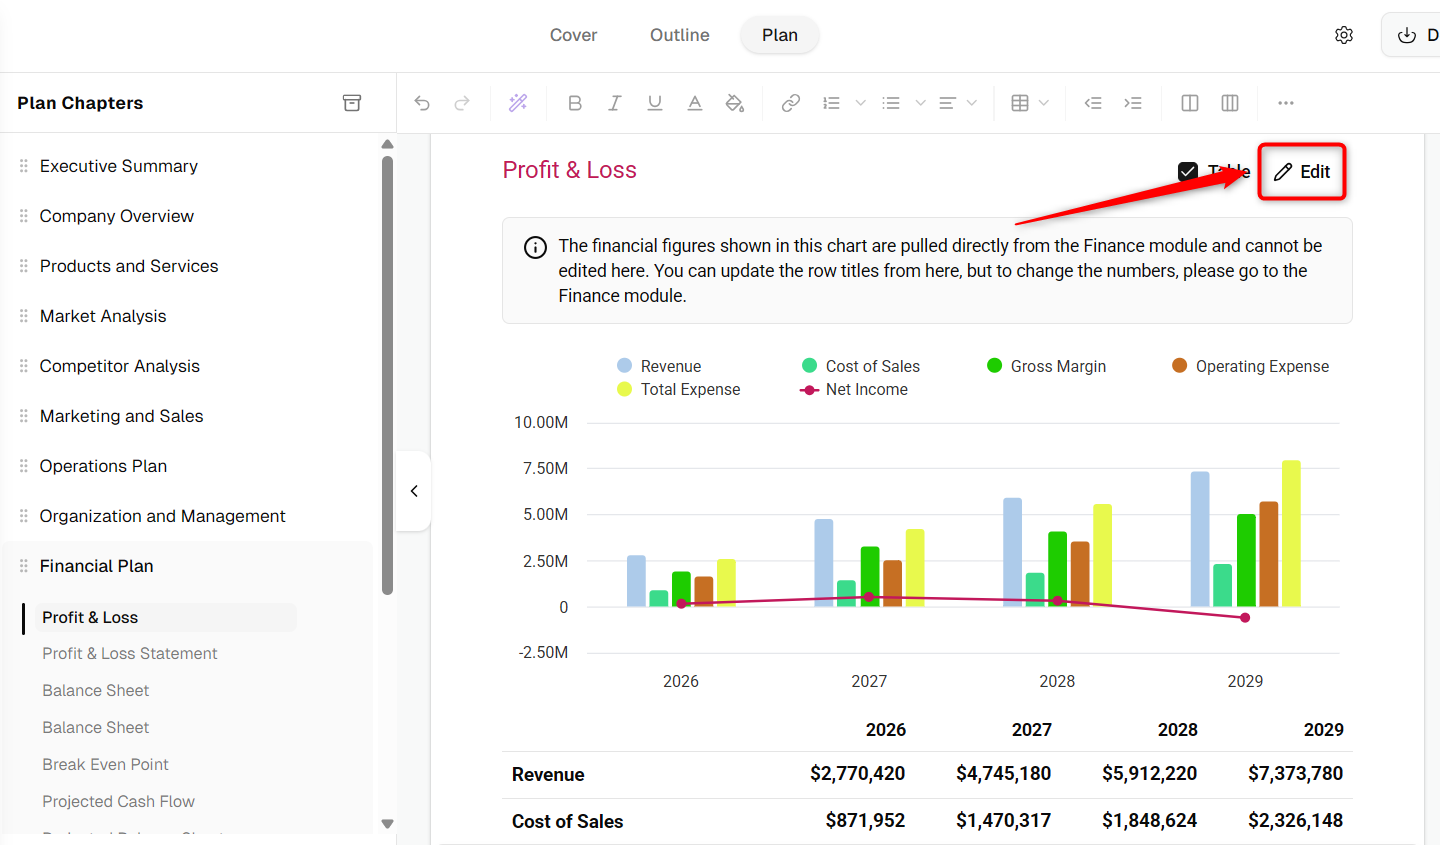
A pop-up appears where you can configure the Y-Axis, set the chart type for each entry under Series, and adjust the Chart Settings (legend, gridlines, axes, log scale, stacking, and bar inversion).
TIP: Want to add finance reports and charts to your business plan? Check out this help guide here.
By customizing these settings, you can present financial data visually in a clear and impactful manner, making it easier to interpret and analyze.