Customizing your pitch
After you create a pitch, the editor is where you turn it into a finished deck. After creating a pitch, you can add new slides, edit content, insert visuals, customize themes, collaborate with teammates, and prepare your presentation for investors.
The editor provides all the tools you need to design professional slides, including text formatting, image uploads, charts, tables, shapes, commenting, and layer management. Once your deck is complete, you can present, publish, or download it directly from Upmetrics.
In this article
TIP: Use themes before finalizing your deck to keep fonts, colors, and overall branding consistent across every slide.
Managing slides
However you start the deck, you build and rearrange it the same way in the editor.
- 1
-
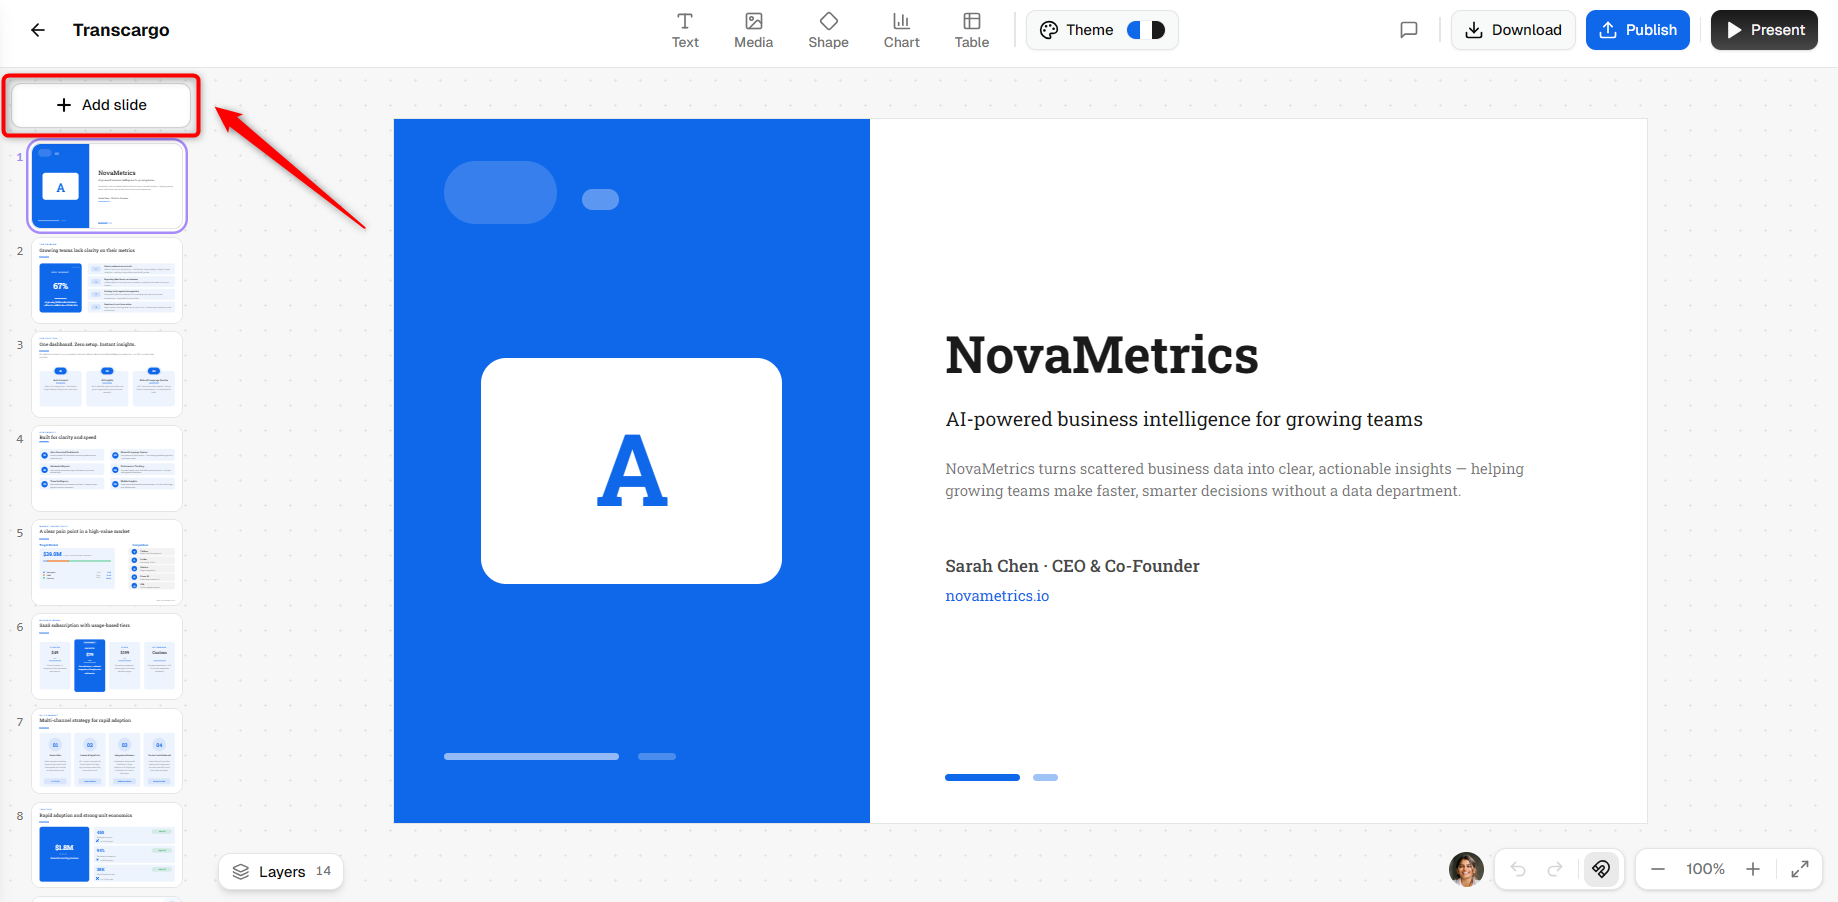
Add a slide. Click Add slide at the top of the sidebar to open the Add a slide window.
- 2
-
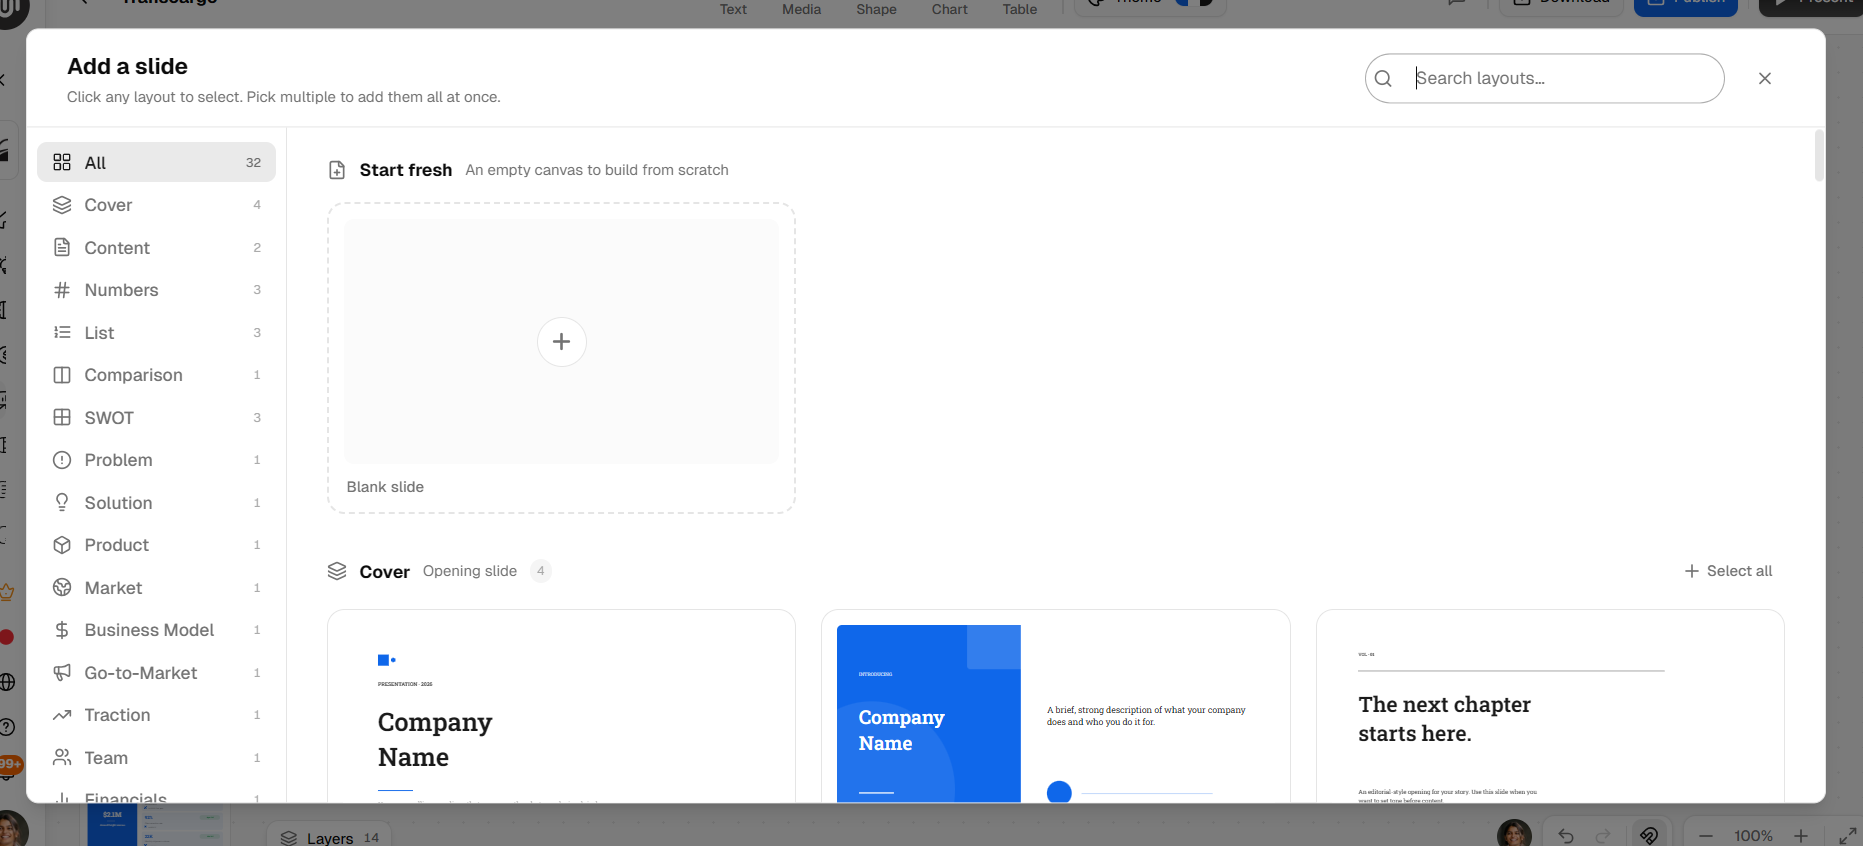
Select a slide layout from one of the available categories, such as Cover, Problem, Solution, Market, Business Model, Go-to-Market, Traction, Team, or Financials.
You can also choose Blank slide under Start fresh to begin with an empty canvas. Use the search bar to quickly find layouts and select multiple layouts to add them at once.
- 3
-
To reorder slides, drag and drop a slide thumbnail within the sidebar.
- 4
-
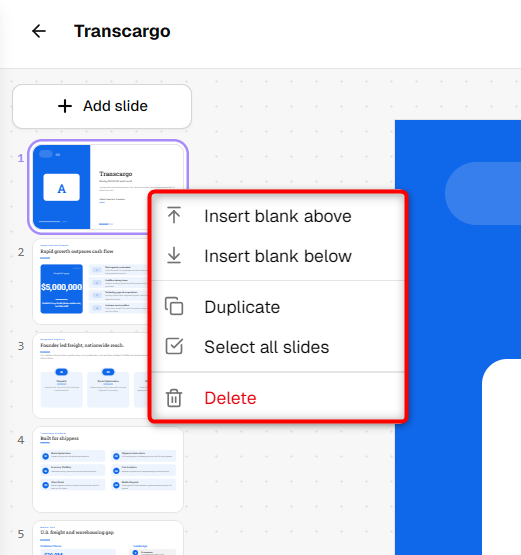
To insert, duplicate, or delete a slide, right-click any slide thumbnail and select the desired option from the menu.


Adding content to a slide
The toolbar at the top center holds everything you add to a slide. Click a tool, choose what you want, and it drops onto the canvas ready to edit.
- 1
-
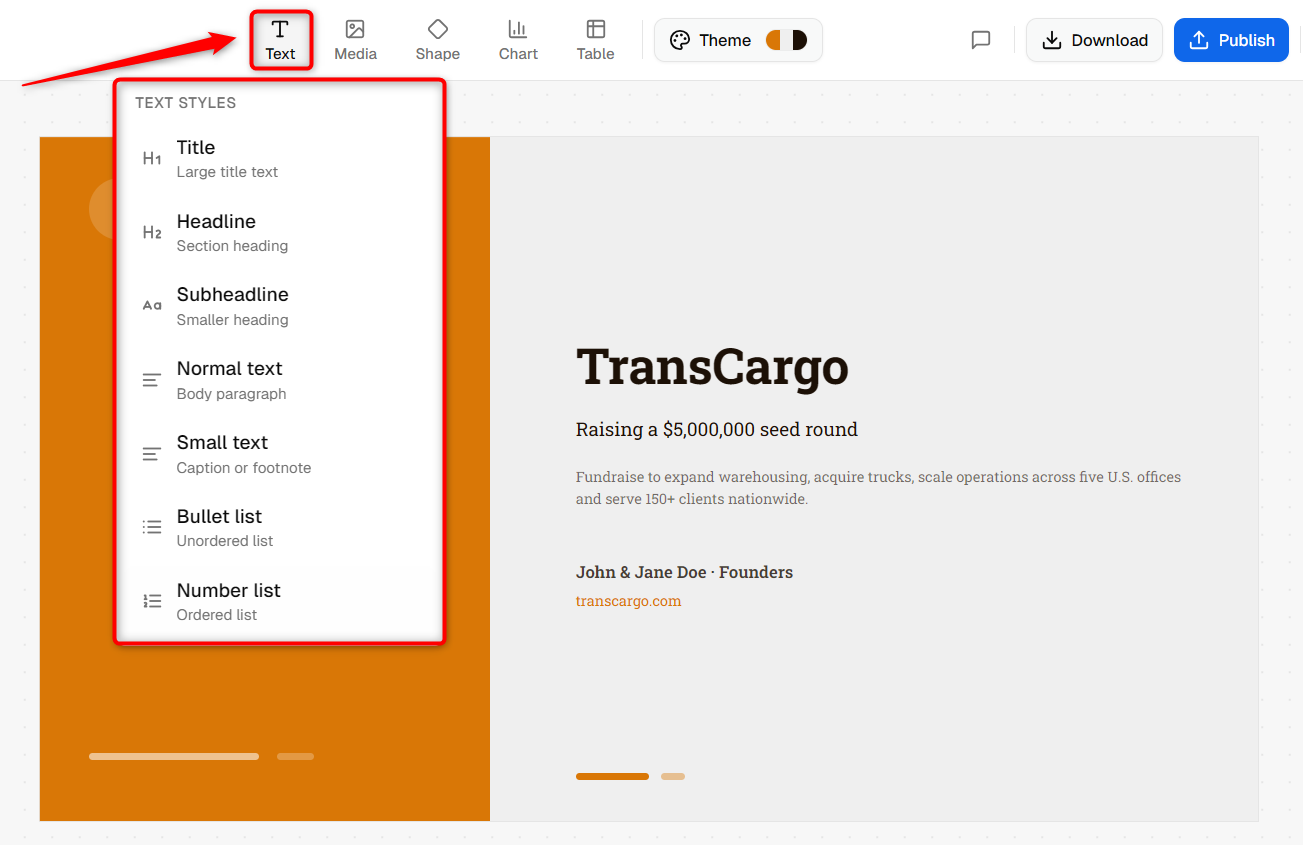
Text:
Click Text to open the Text styles menu, then pick a style: Title, Headline, Subheadline, Normal text, Small text, Bullet list, or Number list. The block lands on the slide, and you click it to start typing.
- 2
-
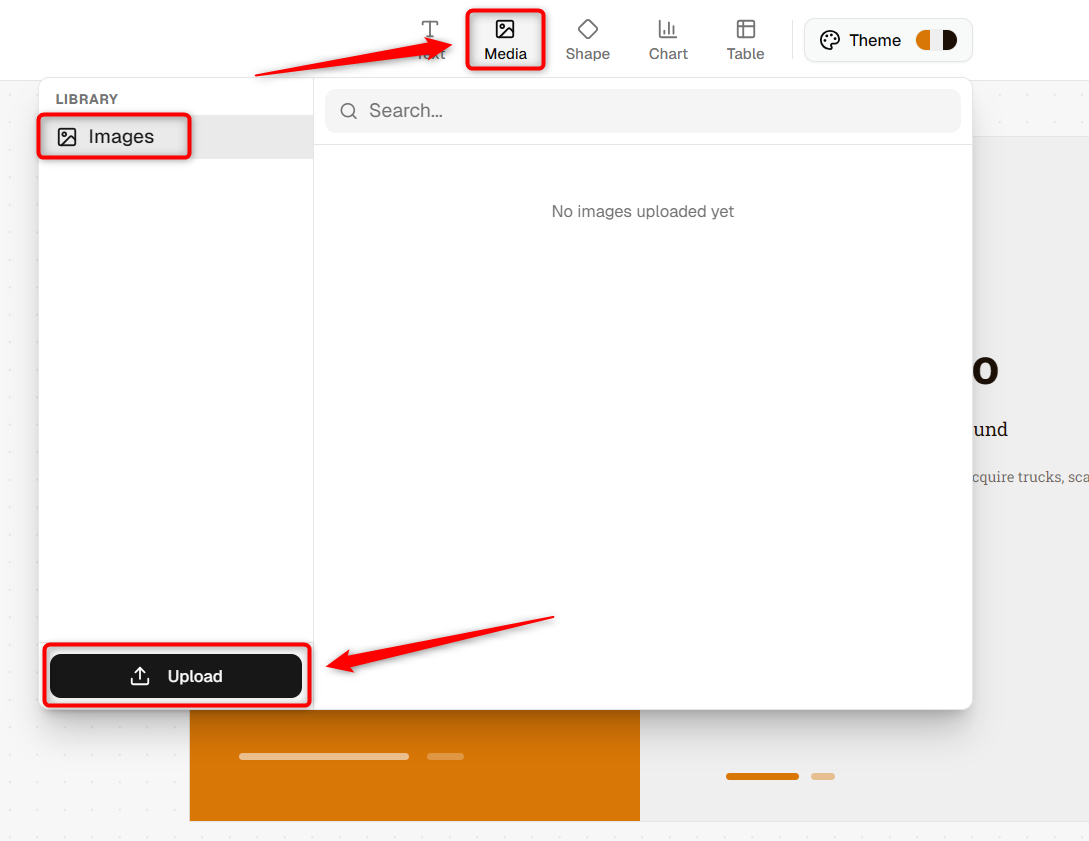
Add images:
Click Media to open the image library. Select Upload to add an image from your device, or search existing uploads. Click an image to place it on the slide.
- 3
-
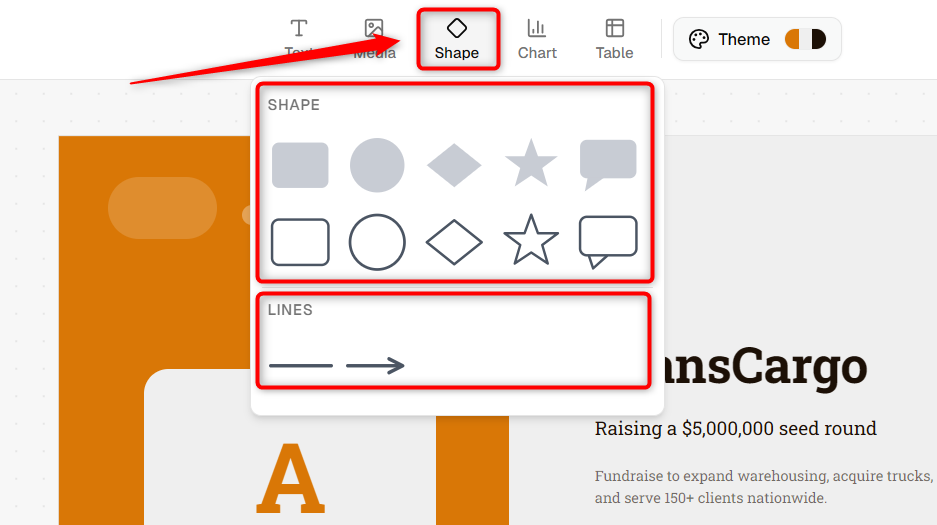
Add shapes and lines:
Click Shape and select a shape, outline, line, or arrow. The selected element is added to the slide, where you can resize and position it as needed.
- 4
-
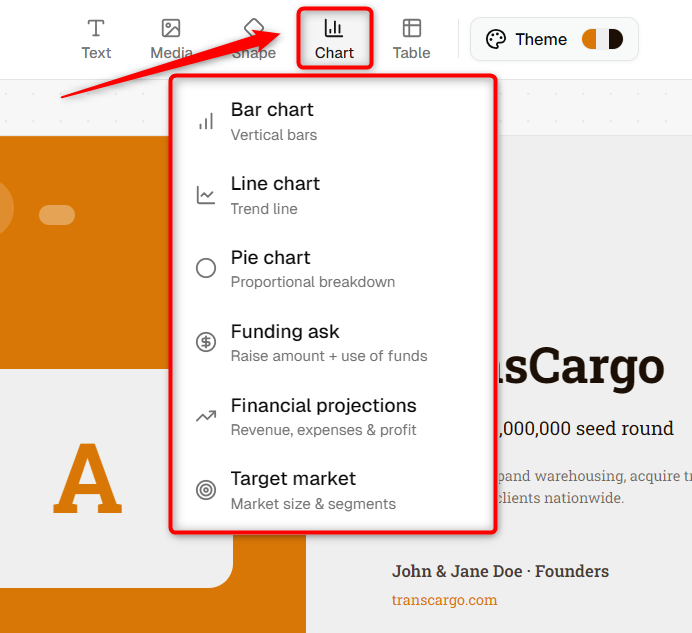
Add charts:
Click Chart and choose a chart type. You can add standard charts such as bar, line, and pie charts, or use pitch-specific options like Funding Ask, Financial Projections, and Target Market.
- 5
-
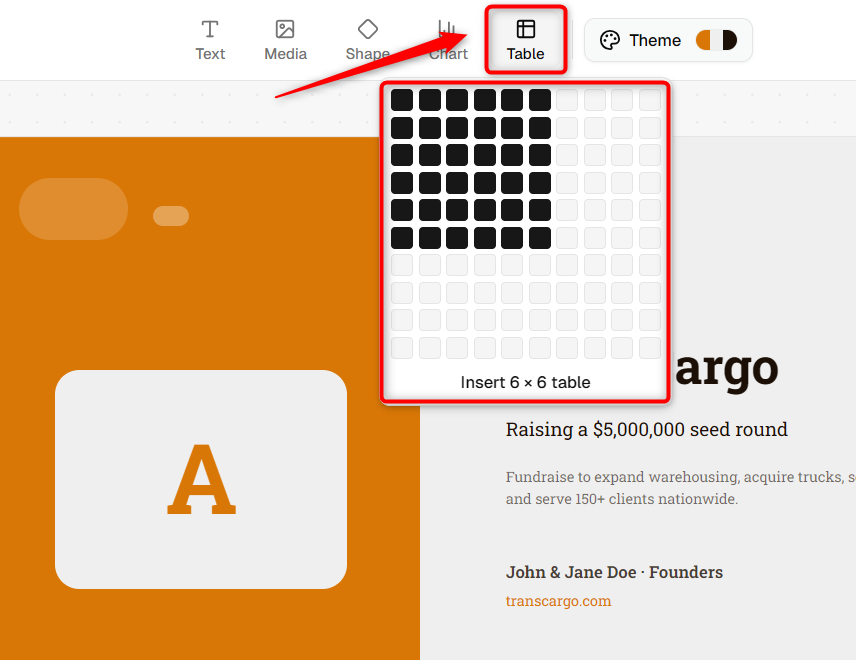
Add tables:
Click Table, select the desired number of rows and columns, and click to insert the table. You can then enter data and customize formatting directly from the table toolbar.


Editing an element
Select any element on the slide to bring up its quick toolbar, where you can change its color, duplicate it, or delete it. Drag the element to reposition it, or drag its handles to resize.
Customizing the theme
The Theme control at the top right sets the overall look of the deck. Click Theme to open the Deck theme panel, where you can adjust three things:
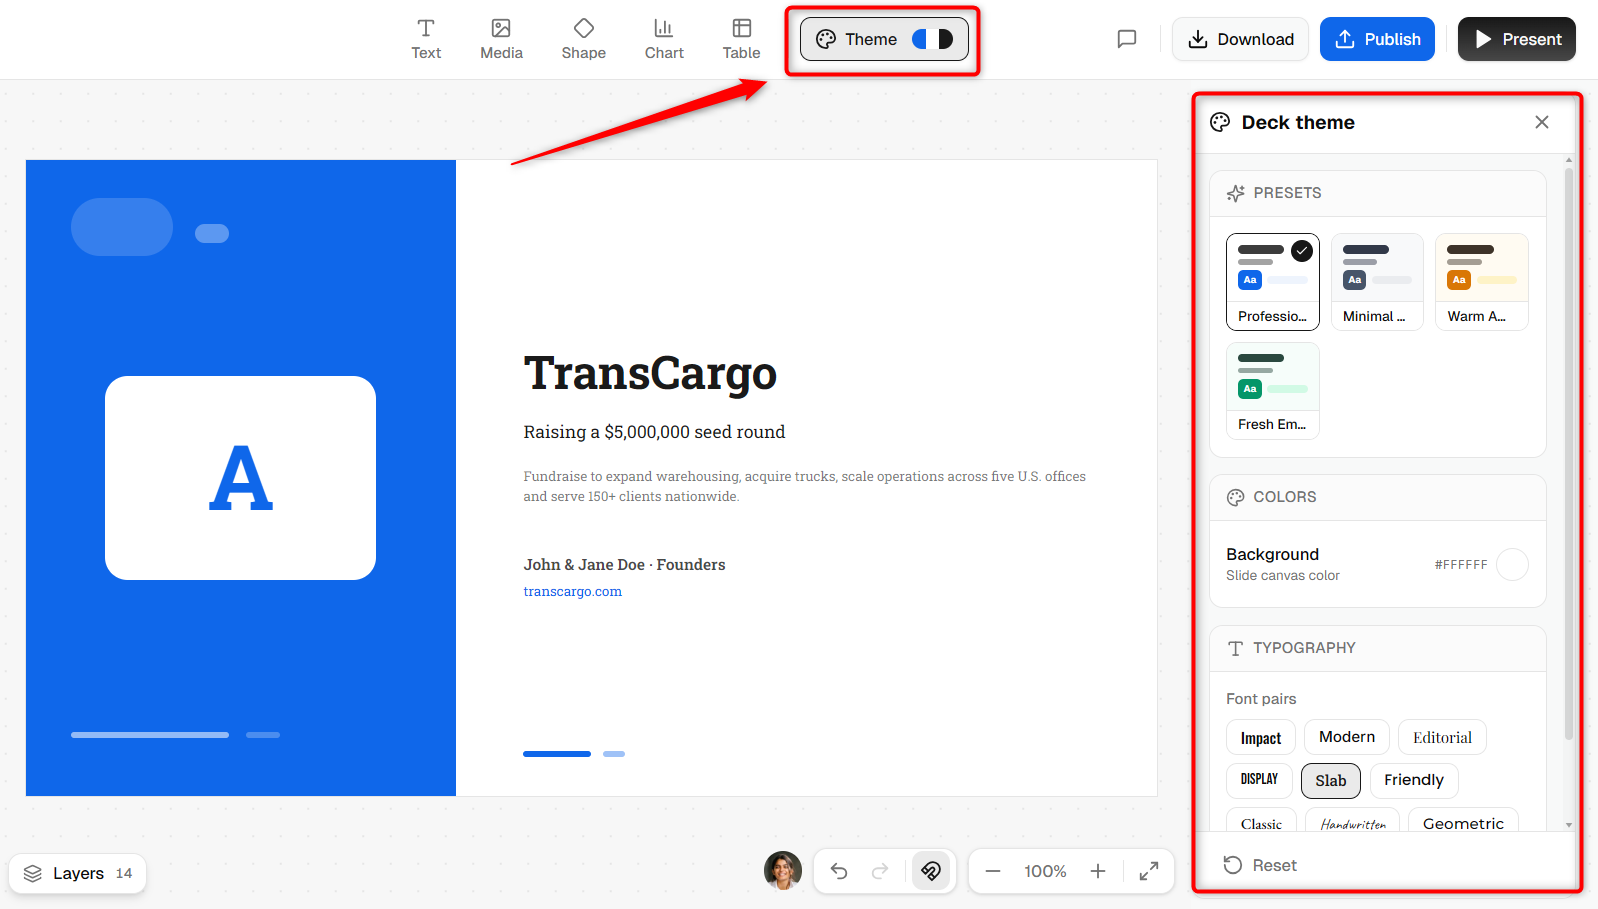
- Presets: ready-made theme styles, such as Professional and Minimal, and more. Click one to apply it to the whole deck. New decks use Professional by default.
- Colors: set the Background (the slide canvas color) with the color swatch or a hex value.
- Typography: choose a Font pair for the deck. Options include Impact, Modern, Editorial, Display, Slab, Friendly, Classic, Handwritten, and Geometric.
- Use Reset at the bottom of the panel to return to the default theme.


Managing Layers In Slide
- Layers: Click Layers at the bottom left to open a panel listing every element on the current slide, each labeled by type, such as a text block or a rectangle.
 The number beside the label shows how many elements the slide holds. Drag a row by its handle to change the stacking order, which helps when pieces overlap and you need to bring the right one forward.
