How to export your finance forecasting data to Excel?
We simplify the process, allowing users to download detailed financial reports in Excel format from the Finance Forecasting module. Whether you're tracking revenue streams, managing expenses, or evaluating financial health through various reports like Profit and Loss or Cash Flow.
This capability ensures that critical financial data is easily accessible for analysis, sharing, and strategic planning.
- 1
-
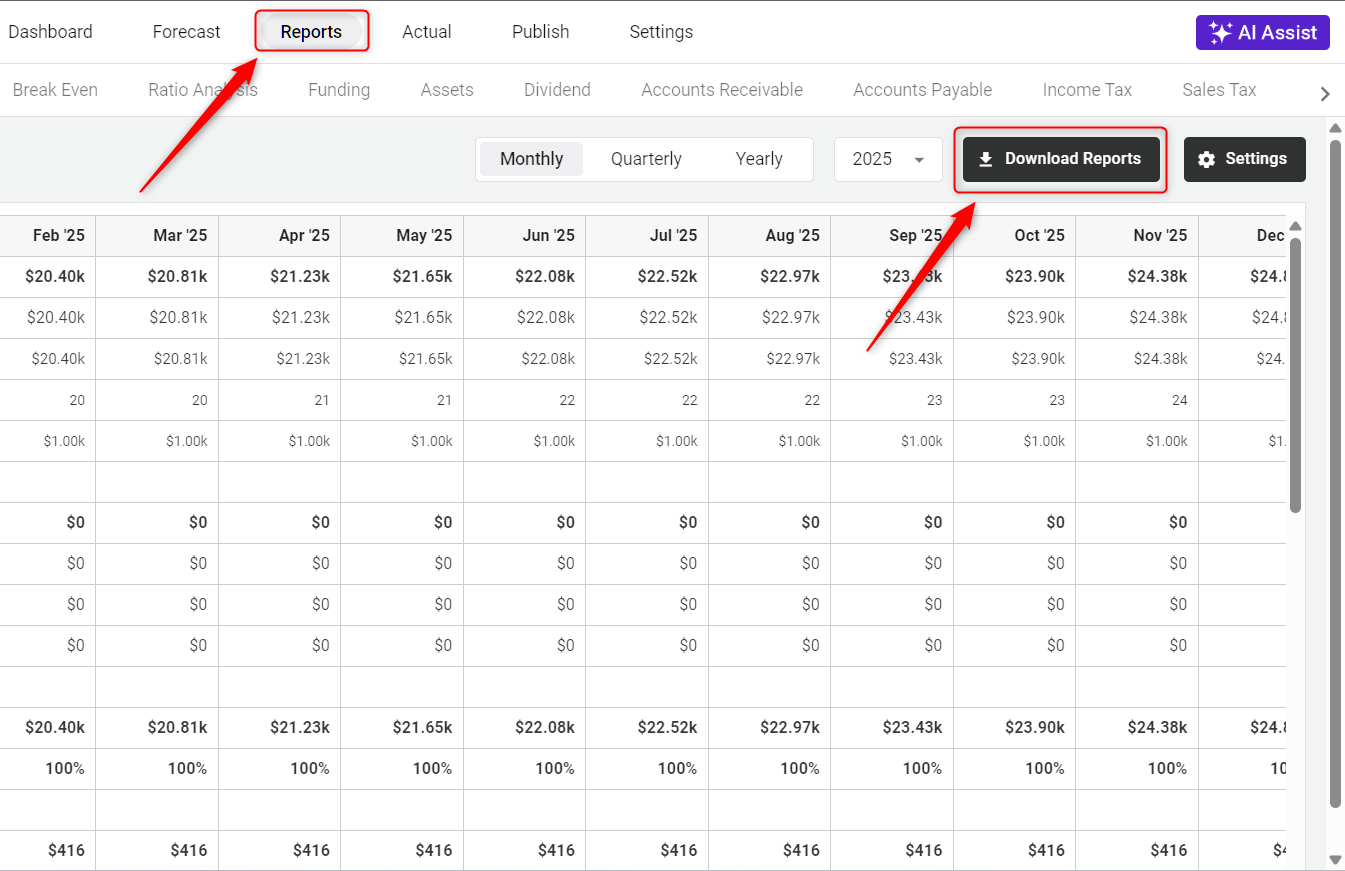
Log in to your account and navigate to the Finance Forecasting module.

- 2
-
For detailed reports containing Profit & Loss, Balance Sheet, Cash Flow, Break Even, Ratio Analysis, and more, you can download your reports directly from the Download Reports option.
- 3
-
By clicking on the Download Reports option, a pop-up window will appear. In this window, you can select the years and specific reports you wish to download.
You can choose multiple years simultaneously if needed. You can easily choose all the reports or years by simply clicking on the Select All button.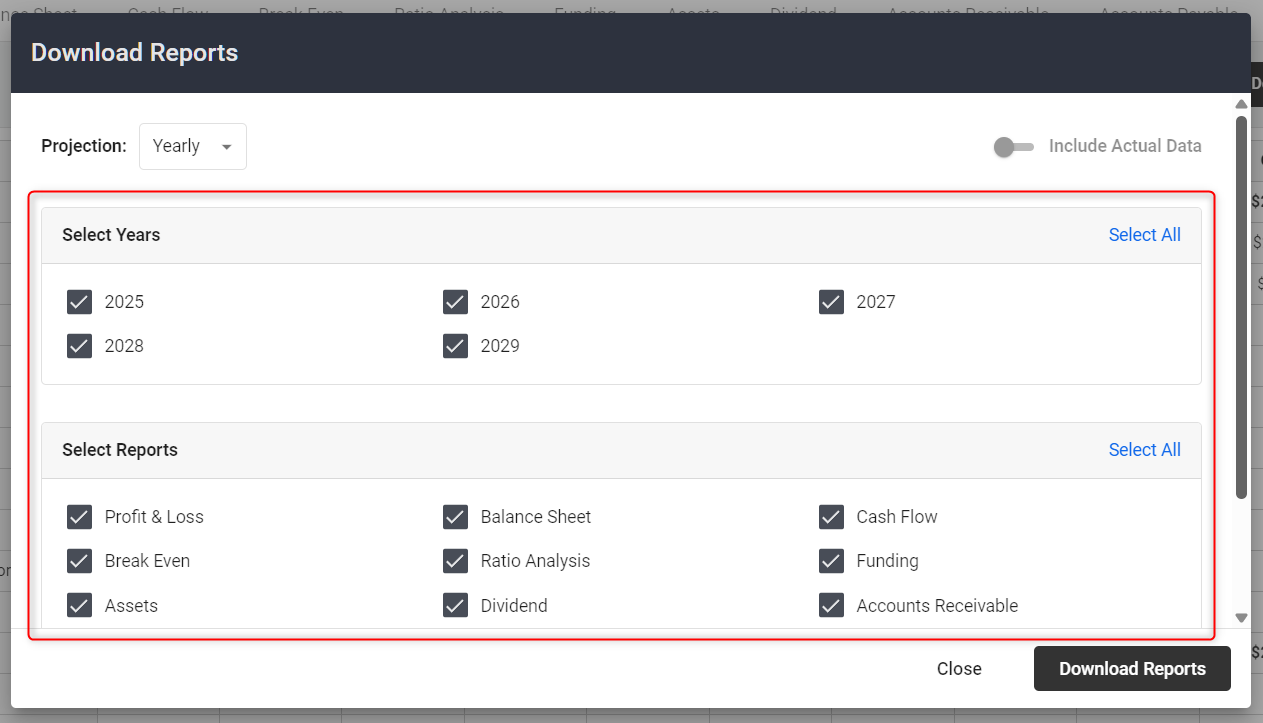
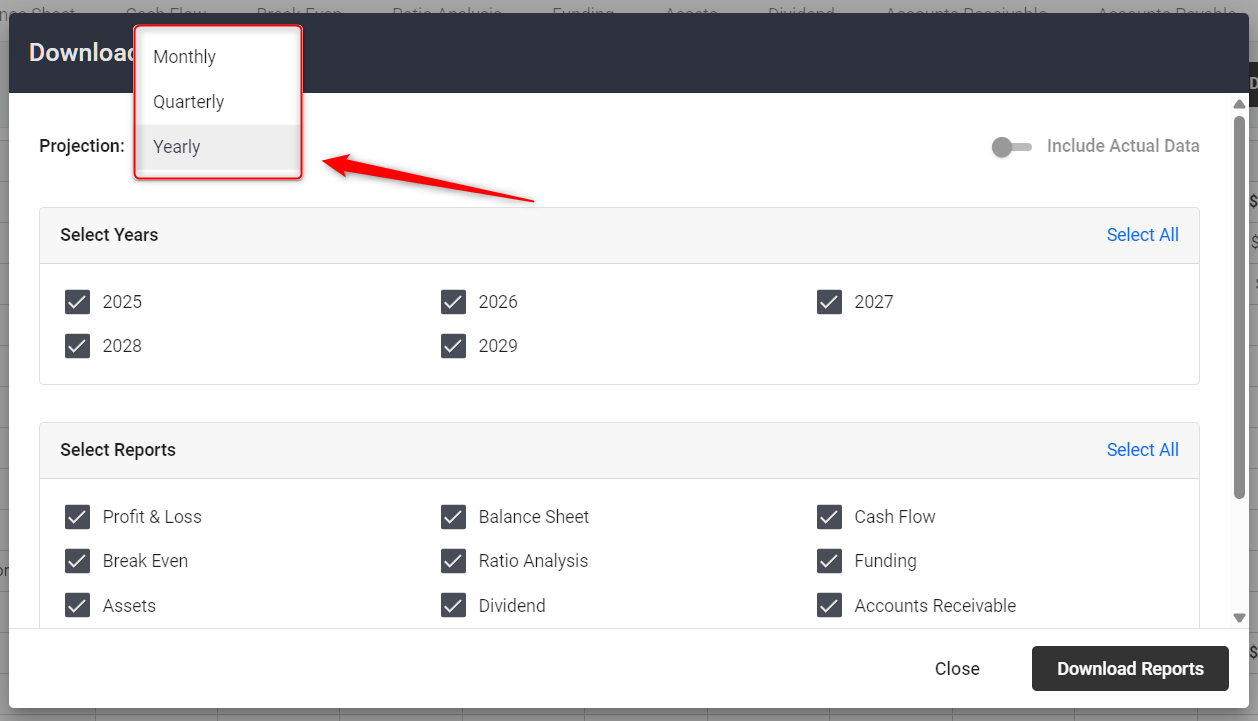
Additionally, you can select the format from the dropdown menu, which offers options for Monthly, Quarterly, or Yearly projections.
- 4
-
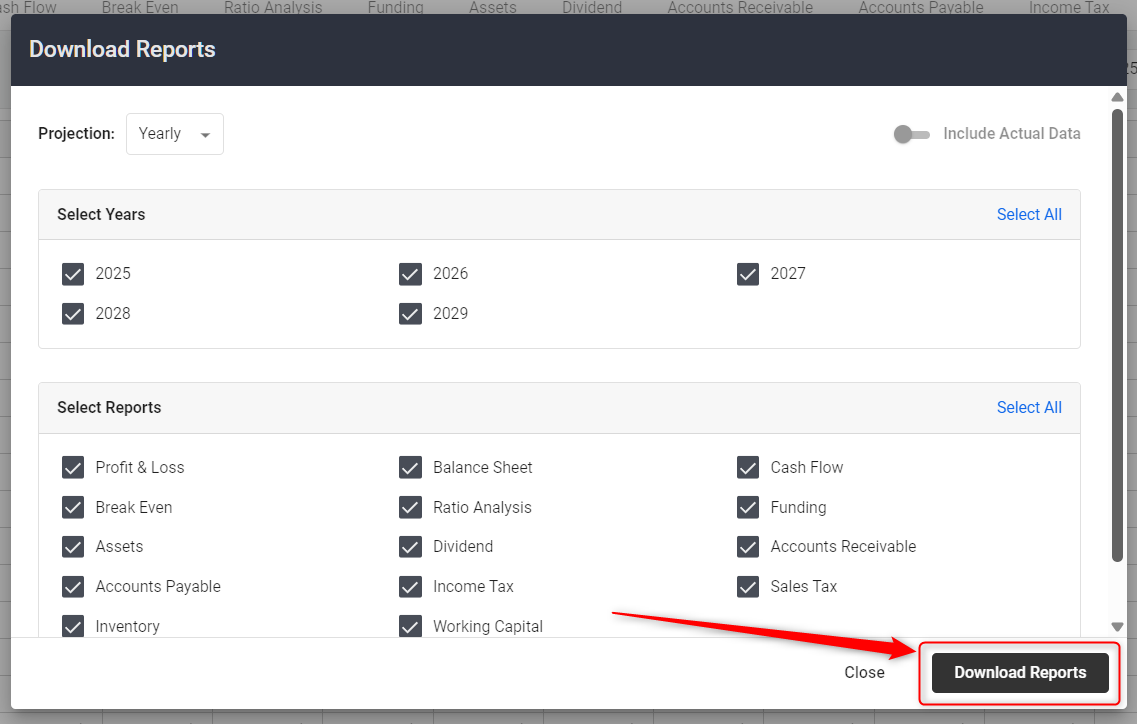
Once you have made your selections, click on the Download Reports option. The system will start downloading the report in Excel format.


Note for Mac Users: If you're facing trouble while downloading reports, verify your Safari browser’s download permissions. For a smoother experience, using Google Chrome is highly recommended.


TIP: If you would like to conduct scenario planning, click here to learn more.

NOTE: When you download your finance report, the Excel sheet won’t include any formulas.
Explore Setting Option:
In the Finance Forecasting module, with the Setting Option, users can customize how they want their reports to appear in Excel.


- Show Detailed Report: This option allows users to include more detailed financial data in the report, providing a comprehensive view of their financial forecasting.
- Show Currency: When enabled, this setting displays the currency symbol alongside the financial figures, making it clear which currency the numbers are in.
- Negative Number with Red Color: This feature highlights negative numbers in red, making it easier to identify losses or deficits at a glance.
- Negative Number with Parentheses: Alternatively, users can choose to display negative numbers enclosed in parentheses, which is a common accounting practice to indicate negative values.
- Show Formatted Numbers: This option ensures that numbers are formatted with commas, decimal points, and other formatting features to enhance readability.
These settings help users tailor the Excel reports to their preferences, making the financial data more accessible and easier to interpret.